Code
# basic imports
import pandas as pd
from matplotlib import pyplot as plt
import seaborn as sns

# make plots look nice
from cmvividly.plots.style import set_style
set_style()

# statistics
from scipy.stats import mannwhitneyuIn the manuscript, we evaluated breadth on each HLA-COcluster (proportion of a repertoire’s TCRs that are members) as a predictor of CMV status, in holdout repertoires (120 donors in Emerson Cohort 2).
The publicly available CMV ECOcluster has AUROCs associated with each HLA-COcluster, describing the performance of HLA-COcluster breadth as a classifier of CMV status in the subset of holdout donors inferred to have the associated HLA allele. Those AUROCs vary quite a lot.
Let’s see if we can figure out why some HLA-COclusters are “better” than others.
Basic imports.
# basic imports
import pandas as pd
from matplotlib import pyplot as plt
import seaborn as sns
# make plots look nice
from cmvividly.plots.style import set_style
set_style()
# statistics
from scipy.stats import mannwhitneyuLoad the 2026 CMV ECOcluster.
# load the CMV ECOcluster, downloading if not already downloaded.
from cmvividly.data.access import load_cmv_ecocluster_2026
pdf_cmv_ecocluster_2026 = load_cmv_ecocluster_2026()
pdf_cmv_ecocluster_2026.columns

# make an HLA-COcluster-level dataframe
from cmvividly.data.manipulation import extract_hlacoclusters_pdf
pdf_hla_coclusters = extract_hlacoclusters_pdf(pdf_cmv_ecocluster_2026)HLA-COclusters are only relevant for people with their associated HLA alleles. Let’s look at the AUROCs defined on those people first. Those are only defined for about half the HLA-COclusters (the rest didn’t have enough HLA-matched samples in holdout to evaluate meaningfully):
pdf_hla_coclusters["has_aware_auroc"] = pdf_hla_coclusters.hla_cocluster_auroc_hlaaware.notnull()
print(pdf_hla_coclusters.has_aware_auroc.value_counts())
has_aware_auroc
False 46
True 45
Name: count, dtype: int64Let’s see the distribution of AUROCs that are present:
f, ax = plt.subplots()
sns.histplot(pdf_hla_coclusters.hla_cocluster_auroc_hlaaware, ax=ax)
f.set_size_inches(6, 2)
ax.set_title("HLA-COcluster HLA-aware AUROCs")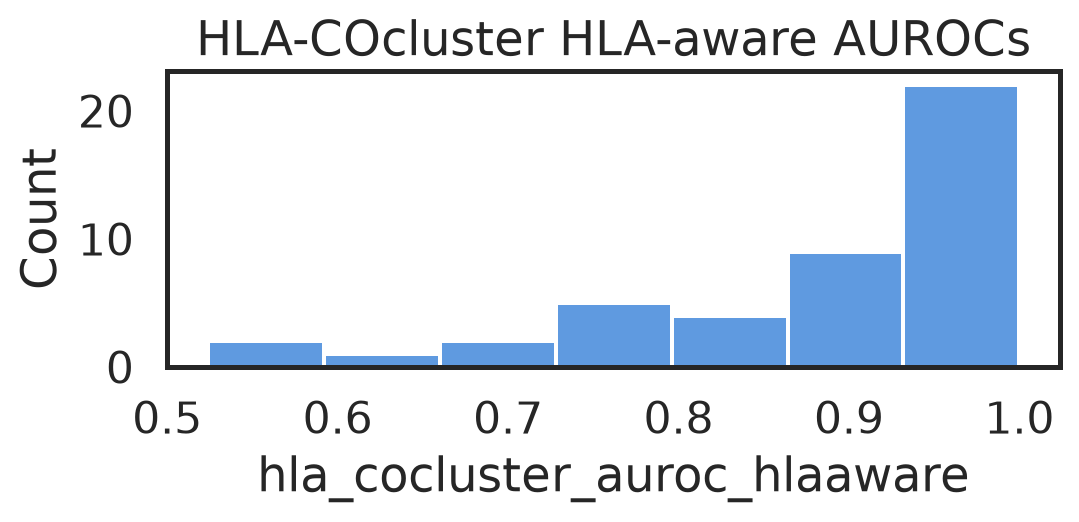
That’s quite a range. They’re mostly very good, but there are a few lousy ones.
Do they differ by HLA class?
f, ax = plt.subplots()
sns.boxplot(data=pdf_hla_coclusters,
            y="hla_cocluster_auroc_hlaaware",
            x="hla_class", ax=ax)
f.set_size_inches(6, 4)
ax.set_title("HLA-COcluster HLA-aware AUROCs by HLA class")
ax.set_ylabel("HLA-aware AUROC")

pdf_hla_coclusters_with_auroc = pdf_hla_coclusters[pdf_hla_coclusters.hla_cocluster_auroc_hlaaware.notnull()]
mwu_p = mannwhitneyu(pdf_hla_coclusters_with_auroc[pdf_hla_coclusters_with_auroc.hla_class == "ci"].hla_cocluster_auroc_hlaaware,
                     pdf_hla_coclusters_with_auroc[pdf_hla_coclusters_with_auroc.hla_class == "cii"].hla_cocluster_auroc_hlaaware,
                     alternative="two-sided").pvalue
mean_higher_class = "Class II" if pdf_hla_coclusters_with_auroc[pdf_hla_coclusters_with_auroc.hla_class == "cii"].hla_cocluster_auroc_hlaaware.mean() > pdf_hla_coclusters[pdf_hla_coclusters.hla_class == "ci"].hla_cocluster_auroc_hlaaware.mean() else "Class I"
print(f"2-sided Mann-Whitney U test p-value: {mwu_p:.3e}. Mean HLA-aware AUROC is higher for {mean_higher_class}.")
2-sided Mann-Whitney U test p-value: 7.949e-02. Mean HLA-aware AUROC is higher for Class II.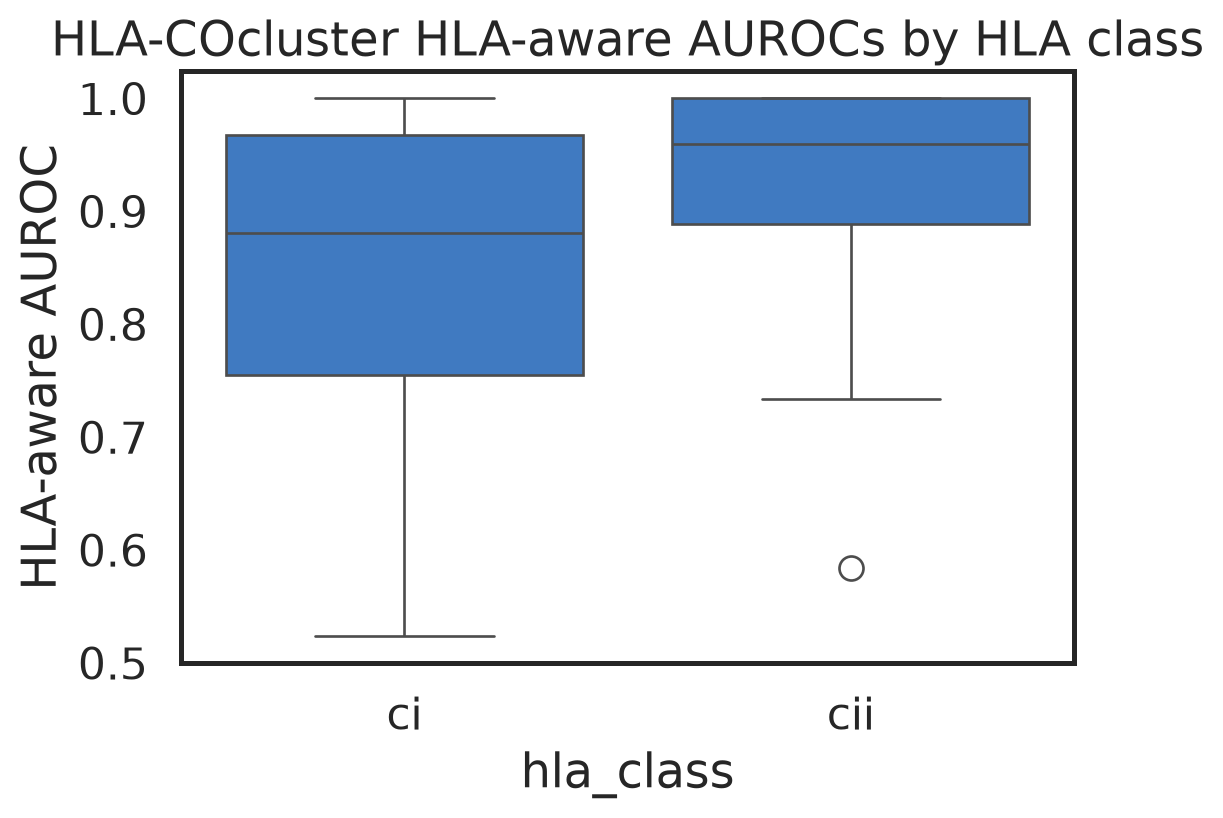
Why, yes, they do! The AUROCs are (barely) significantly higher for HLA-COclusters associated with Class II alleles than for Class I. Let’s look at the worst ones:
pdf_hla_coclusters.sort_values("hla_cocluster_auroc_hlaaware")[["hla_cocluster", "hla_cocluster_auroc_hlaaware",
]].head(5)| hla_cocluster | hla_cocluster_auroc_hlaaware | |
|---|---|---|
| 28 | h-C_07_02-298 | 0.523810 |
| 36 | h-DPA1_01_03_DPB1_04_01-6 | 0.583546 |
| 0 | h-A_01_01-169 | 0.625000 |
| 14 | h-B_18_01-153 | 0.666667 |
| 20 | h-B_40_02-68 | 0.708333 |
HLA-COclusters vary widely in cardinality. Does the number of TCRs in an HLA-COcluster correlate with its AUROC?
f, ax = plt.subplots()
sns.scatterplot(x="n_tcrs", y="hla_cocluster_auroc_hlaaware",
                data=pdf_hla_coclusters, hue="hla_class")
ax.set_title("HLA-COcluster HLA-aware AUROC vs.\nTCRs in the HLA-COcluster")
ax.set_ylabel("HLA-aware AUROC")
ax.set_xlabel("TCRs in HLA-COcluster")
It sure does! The biggest HLA-Coclusters (all Class II) all look stellar. The worst ones are mostly small (except one with ~1000 TCRs), though most small ones are also very good. And, as we saw in the Basics post, Class II-associated HLA-COclusters tend to be larger than Class I.
So, it seems plausible that some of the CMV HLA-COclusters don’t perform well as diagnostics because they have too few TCRs. That could be for multiple reasons:
In the manuscript, we also calculated an HLA-unaware AUROC for every HLA-COcluster. We expect those to be full of noise, because they include many people without the associated HLA allele. But are some of them good, anyway?
f, ax = plt.subplots()
sns.boxplot(x="has_aware_auroc", y="hla_cocluster_auroc_hlaunaware", data=pdf_hla_coclusters, ax=ax)
ax.set_title("HLA-COcluster HLA-unaware AUROCs\nby presence of HLA-aware AUROC")
ax.set_ylabel("HLA-unaware AUROC")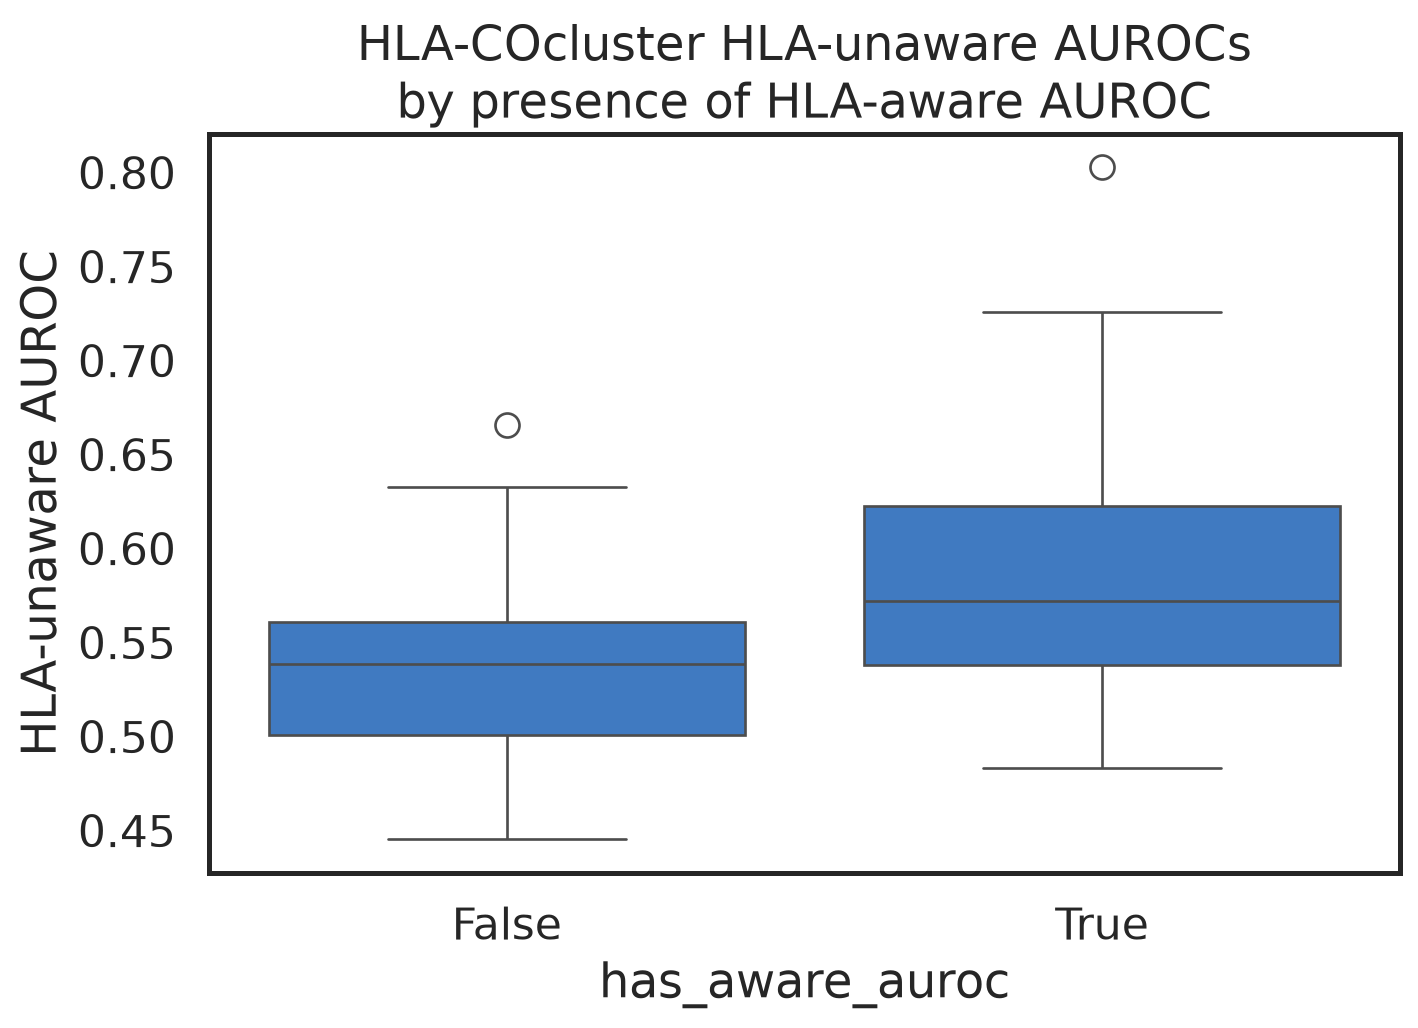
Not really, no! And there are some high-ish HLA-unaware AUROCs, but they’re all on HLA-COclusters that had enough samples in holdout to evaluate HLA-aware. That makes sense! If there aren’t enough samples in holdout to evaluate HLA-aware, we’re looking at a rare allele whose HLA-unaware AUROC will be swamped by noise.