IEDB can annotate TCRs with peptide/species associations, but many TCRs appear to be cross-reactive.
Published
August 21, 2026
1 Takeaways from this post
The CMV ECOcluster TCR intersection with IEDB is strongly enriched for CMV-annotated TCRs
We can propagate IEDB CMV epitope antigens across sequence clusters to make the CMV ECOcluster / repertoire intersection more interpretable
We see many CMV ECOcluster TCRs (TCRBs) annotated in IEDB as binding non-CMV epitopes.
Those annotations are very likely “real”: CMV’s repertoire impact is so strong that it defines the TCRs’ occurrence in repertoires regardless of cross-reactivity
Many non-CMV associations are likely explained by multiple TCRA pairing.
TCRBs can respond to different peptides that presented by different prevalent immune exposures
Therefore, repertoire TCRB annotation via TCRB-pMHC binding evidence alone is tenuous
We can have more confidence in annotation of lower-pGen TCRs
Code
# useful importsimport pandas as pdfrom matplotlib import pyplot as pltimport itablesimport seaborn as snsfrom cmvividly.plots.style import set_styleset_style()import itablesitables.init_notebook_mode()#statsfrom scipy.stats import mannwhitneyu
2 Preparing IEDB for ECOcluster intersection
IEDB is one of the big databases of TCR-pMHC specificity. Due to differences in V and J gene annotation by different pipelines, I like to match Adaptive TCRs with other data sources like IMDB on V family and CDR3 amino acid sequence.
I downloaded all the TCRs and did two processing steps:
shaped up the TCR V family assignments so that the V family name matched the Adaptive-style names used in the CMV ECOcluster
ran OLGA to estimate generation probability from each TCR’s V gene, J gene and amino acid sequence.
3 Load CMV ECOcluster, load IEDB, and intersect
Code
from cmvividly.data.access import load_cmv_ecocluster_2026, PROCESSED_DIRpdf_cmv_ecocluster_2026 = load_cmv_ecocluster_2026()print(f"Loaded {len(pdf_cmv_ecocluster_2026)} TCRs from CMV ECOcluster 2026")pdf_cmv_ecocluster_2026_formerge = pdf_cmv_ecocluster_2026.copy()pdf_cmv_ecocluster_2026_formerge["vfamily"] = pdf_cmv_ecocluster_2026_formerge.vgene.str.split("-").str[0]pdf_cmv_ecocluster_2026_formerge["tcr_vfamcdr3"] = pdf_cmv_ecocluster_2026_formerge.cdr3 +"+"+ pdf_cmv_ecocluster_2026_formerge.vfamilypdf_cmv_ecocluster_2026_formerge_dedup = pdf_cmv_ecocluster_2026_formerge.drop_duplicates( subset=["tcr_vfamcdr3"])print(f"Deduplicated on (cdr3+vfamily): {len(pdf_cmv_ecocluster_2026_formerge_dedup)} TCRs")pdf_iedb_tcrs = pd.read_csv(PROCESSED_DIR /"iedb_tcrs.tsv", sep="\t")# There are ~1400 TCRs in IEDB with no species assignment. They're useless for our purposes, so let's drop them.pdf_iedb_tcrs = pdf_iedb_tcrs[pdf_iedb_tcrs.epitope_species.notnull()]n_iedb_tcrs =len(set(pdf_iedb_tcrs.tcr_vfamcdr3))print(f"Loaded {len(pdf_iedb_tcrs)} rows ({n_iedb_tcrs} cdr3+vfamily TCRs) from IEDB")pdf_cmveco_in_iedb = pdf_cmv_ecocluster_2026_formerge_dedup.merge( pdf_iedb_tcrs.drop(columns=["tcr_pgen"]), how="inner", on="tcr_vfamcdr3", suffixes=["_ecocluster", "_iedb"])n_tcrs_intersect =len(set(pdf_cmveco_in_iedb.tcr_vfamcdr3))print(f"Intersection: {len(pdf_cmveco_in_iedb)} rows ({n_tcrs_intersect} cdr3+vfamily TCRs)")
Loaded 52447 TCRs from CMV ECOcluster 2026
Deduplicated on (cdr3+vfamily): 51361 TCRs
Loaded 154448 rows (141416 cdr3+vfamily TCRs) from IEDB
Intersection: 538 rows (389 cdr3+vfamily TCRs)
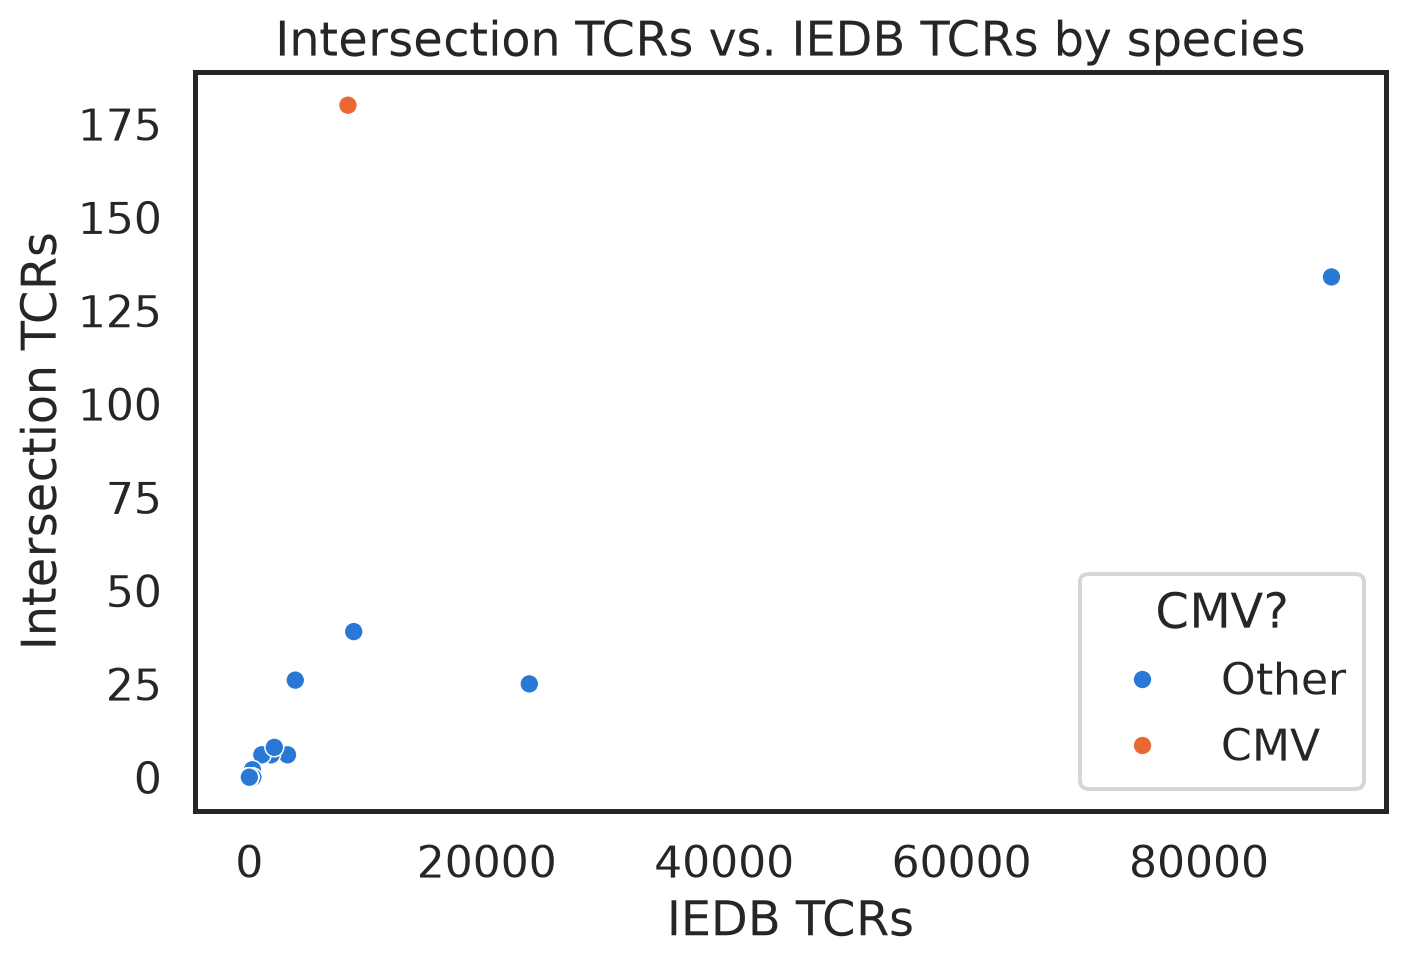
Let’s take a look at the per-species counts of the intersection TCRs vs. all the IEDB TCRs (double-counting both if they appear in multiple species).
CMV is as clear an outlier as it could be. I could pin that down with a statistical test, but I’m not going to bother.
SARS-CoV-2 has the second highest intersection, which is pretty obviously explained by the fact that it has far more IEDB TCRs than any other species.
That’s a critical, generalizable point: gather enough TCRs associated with a given {epitope, species, whatever}, and intersect them with some other group of TCRs, and you’ll get some intersection. It’s possible some of those IEDB TCR-peptide associations are experimentally “wrong” (i.e., the TCR doesn’t actually recognize that peptide). But it’s just as possible those TCRs recognize multiple peptides. We’re just matching on TCRB, so they could very well be pairing with a different TCRA.
4 pGen of TCRs by ECOcluster membership and IEDB species
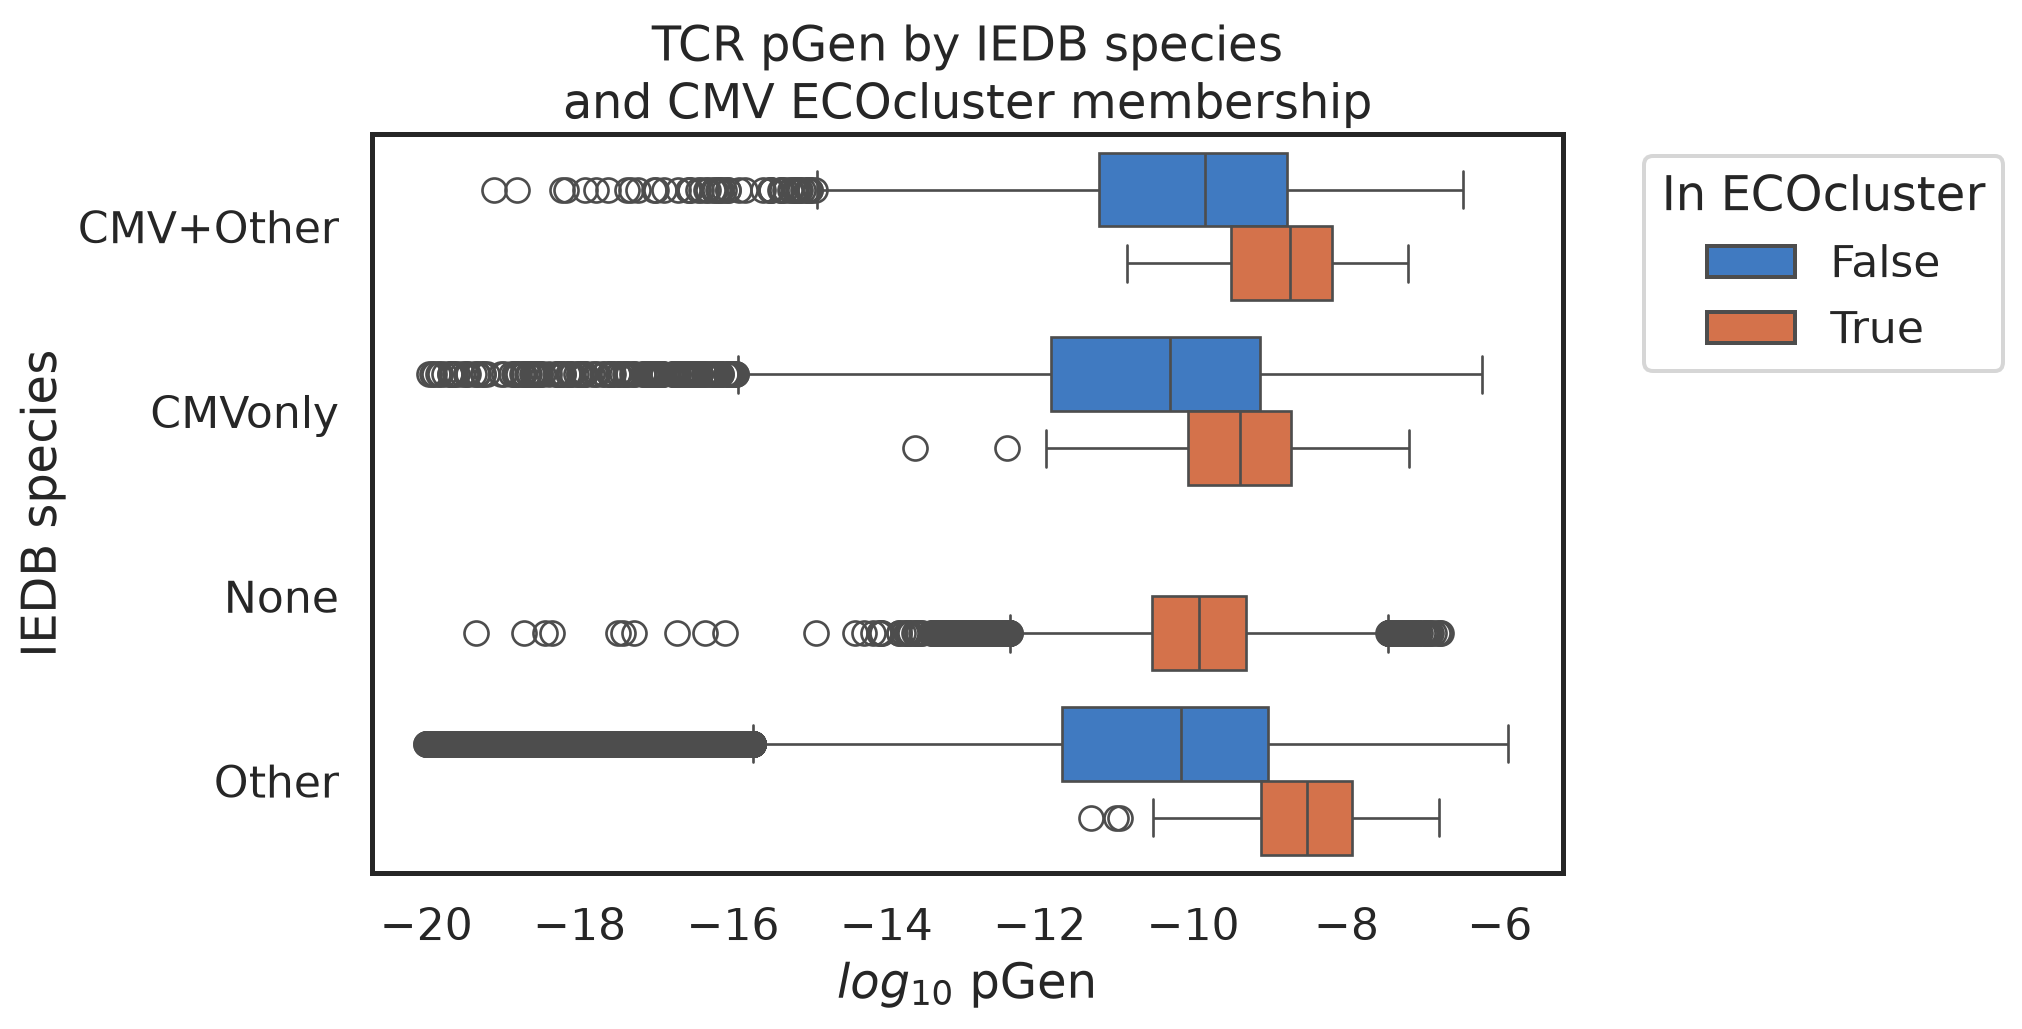
Because ECOclusters are defined on co-occurrence in repertoires, TCRs in the CMV ECOcluster must have relatively high pGen compared with repertoire TCRs at large. On average, we should expect them to have higher pGen than TCRs in IEDB. But what about CMV ECOcluster TCRs that intersect IEDB? How does that break down by which species the TCR is associated with in IEDB?
Code
import numpy as nppdf_iedb_formerge = pdf_iedb_tcrs.sort_values("tcr_pgen", ascending=False).drop_duplicates(["epitope_species", "tcr_vfamcdr3"])[ ["tcr_vfamcdr3", "epitope_species", "tcr_pgen"]]pdf_cmveco_inters_iedb = pdf_cmv_ecocluster_2026_formerge_dedup.merge( pdf_iedb_formerge, on="tcr_vfamcdr3", how="inner", suffixes=["_ecocluster", "_iedb"])# populate tcr_pgen as the max of tcr_pgen_ecocluster and tcr_pgen_iedbpdf_cmveco_inters_iedb["tcr_pgen"] = pdf_cmveco_inters_iedb[["tcr_pgen_ecocluster", "tcr_pgen_iedb"]].max(axis=1)def assign_species_category(species_series): notnull_species =set(species_series) notnull_species =set([s for s in notnull_species if pd.notnull(s)])iflen(notnull_species) ==0:return"None"eliflen(notnull_species) ==1:return"CMVonly"if"CMV"in notnull_species else"Other"else:return"CMV+Other"if"CMV"in notnull_species else"Other"pdf_cmveco_inters_iedb_dedup = pdf_cmveco_inters_iedb.sort_values("tcr_pgen", ascending=False).groupby("tcr_vfamcdr3").agg({"epitope_species": assign_species_category,"tcr_pgen": "first"}).reset_index()pdf_cmveco_inters_iedb_dedup = pdf_cmveco_inters_iedb_dedup.rename(columns={"epitope_species": "species_category"})pdf_cmveco_inters_iedb_dedup["In ECOcluster"] =True# find the TCRs in ECOcluster that are not in IEDB, and assign them a species category of "None"pdf_cmveco_not_in_iedb = pdf_cmv_ecocluster_2026_formerge_dedup[~pdf_cmv_ecocluster_2026_formerge_dedup.tcr_vfamcdr3.isin(set(pdf_cmveco_inters_iedb.tcr_vfamcdr3))]pdf_cmveco_not_in_iedb_formerge = pdf_cmveco_not_in_iedb[["tcr_vfamcdr3", "tcr_pgen"]].copy()pdf_cmveco_not_in_iedb_formerge["species_category"] ="None"pdf_cmveco_not_in_iedb_formerge["In ECOcluster"] =True# find the TCRs in IEDB that are not in ECOcluster, and assign them a species category using assign_species_categorypdf_iedb_not_in_ecocluster = pdf_iedb_formerge[~pdf_iedb_formerge.tcr_vfamcdr3.isin(set(pdf_cmveco_inters_iedb.tcr_vfamcdr3))]pdf_iedb_not_in_ecocluster_dedup = pdf_iedb_not_in_ecocluster.drop_duplicates(["tcr_vfamcdr3", "epitope_species"])pdf_iedb_not_in_ecocluster_dedup = pdf_iedb_not_in_ecocluster_dedup.sort_values("tcr_pgen", ascending=False).groupby("tcr_vfamcdr3").agg( {"epitope_species": assign_species_category,"tcr_pgen": "first" }).reset_index()pdf_iedb_not_in_ecocluster_dedup = pdf_iedb_not_in_ecocluster_dedup.rename(columns={"epitope_species": "species_category"})pdf_iedb_not_in_ecocluster_dedup["In ECOcluster"] =Falsepdf_iniedb_speciescat_genprob = pd.concat([pdf_cmveco_inters_iedb_dedup[["tcr_vfamcdr3", "tcr_pgen", "species_category", "In ECOcluster"]], pdf_cmveco_not_in_iedb_formerge[["tcr_vfamcdr3", "tcr_pgen", "species_category", "In ECOcluster"]], pdf_iedb_not_in_ecocluster_dedup[["tcr_vfamcdr3", "tcr_pgen", "species_category", "In ECOcluster"]] ])pdf_iniedb_speciescat_genprob["log10_tcr_pgen"] = np.log10(pdf_iniedb_speciescat_genprob.tcr_pgen +1e-50)pdf_iniedb_speciescat_genprob_forplot = pdf_iniedb_speciescat_genprob[pdf_iniedb_speciescat_genprob.log10_tcr_pgen >-20]pdf_iniedb_speciescat_genprob_forplot = pdf_iniedb_speciescat_genprob_forplot.sort_values(["species_category", "In ECOcluster"])f, ax = plt.subplots()sns.boxplot(x="log10_tcr_pgen", hue="In ECOcluster", data=pdf_iniedb_speciescat_genprob_forplot, y="species_category", orient="horiz" )ax.legend(bbox_to_anchor=(1.05, 1), loc="upper left", title="In ECOcluster")ax.set_ylabel("IEDB species")ax.set_xlabel("${log}_{10}$ pGen")ax.set_title("TCR pGen by IEDB species\nand CMV ECOcluster membership")
Sure enough, within each species category, the TCRs in the CMV ECOcluster (orange) have dramatically higher pGen than those not in the ECOcluster (blue). Breaking it down further, by eye it looks like:
The TCRs in CMV and other species have higher median pGen than those in CMV only
This is true both within TCRs in the ECOcluster and those not in the ECOcluster
Let’s test those three comparisons statistically using one-sided MWU tests, since those trends are both in the direction we’d expect.
Code
pdf_notin_eco = pdf_iniedb_speciescat_genprob_forplot[pdf_iniedb_speciescat_genprob_forplot["In ECOcluster"] ==False]pdf_in_eco = pdf_iniedb_speciescat_genprob_forplot[pdf_iniedb_speciescat_genprob_forplot["In ECOcluster"]]mwup_notineco_cmvonly_vs_multi = mannwhitneyu(pdf_notin_eco[pdf_notin_eco.species_category =="CMVonly"].tcr_pgen, pdf_notin_eco[pdf_notin_eco.species_category =="CMV+Other"].tcr_pgen, alternative="less").pvaluemwup_ineco_cmvonly_vs_multi = mannwhitneyu(pdf_in_eco[pdf_in_eco.species_category =="CMVonly"].tcr_pgen, pdf_in_eco[pdf_in_eco.species_category =="CMV+Other"].tcr_pgen, alternative="less").pvalue# Among in-eco, compare Other vs. CMV+mwup_ineco_other_vs_multi = mannwhitneyu(pdf_in_eco[pdf_in_eco.species_category =="Other"].tcr_pgen, pdf_in_eco[pdf_in_eco.species_category =="CMV+Other"].tcr_pgen, alternative="greater").pvalueprint(f"Mann-Whitney U test p-values:")print(f"Not in ECOcluster, CMV+Other vs. CMVOnly: {mwup_notineco_cmvonly_vs_multi:.2e}")print(f"In ECOcluster, CMV+Other vs. CMVOnly: {mwup_ineco_cmvonly_vs_multi:.2e}")
Mann-Whitney U test p-values:
Not in ECOcluster, CMV+Other vs. CMVOnly: 1.43e-23
In ECOcluster, CMV+Other vs. CMVOnly: 2.09e-03
So, those differences are both significant.
All those observations are consistent with the same central idea: the more contexts we observe a TCR in, the higher its pGen must be.
That suggests a corollary: lower-pGen TCRs are less likely to be observed binding multiple peptides, even if they do bind multiple peptides presented by real-world exposures.
That means that observed peptide/exposure associations for TCRs with lower pGen are, in a sense, “safer”: if you see them again in a different context, they’re more likely to be observed in that context because they’re binding the same peptide.
I think the reason for that isn’t that lower-pGen TCRBs are less likely to be cross-reactive (though I don’t rule that out), but rather because they’re less likely to be in a donor’s naive repertoire at all, or, if they are, to come into contact with a given peptide (because fewer naive TCR rearrangements code for the same TCR amino acid sequence).
Again, we’re talking about TCRBs, so TCR observations in multiple contexts could well be explained by multiple TCRA partners.
5 Peptide-level breakdown of IEDB intersection
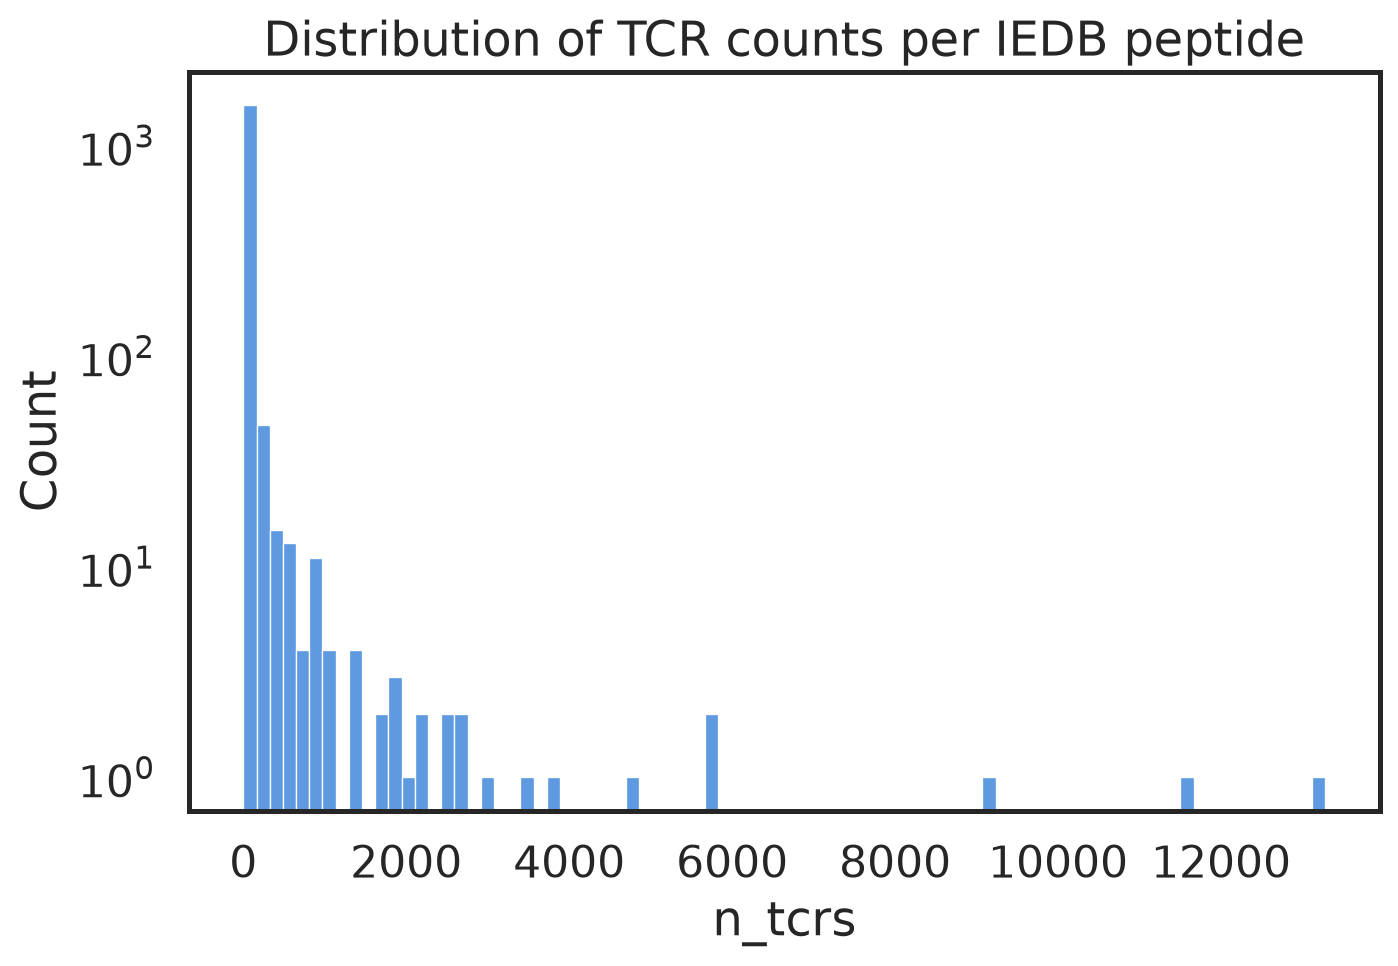
Let’s see how the TCR counts per peptide in IEDB are distributed (note log y scale). Are they as skewed as the counts per species?
Code
pdf_iedb_peptide_tcrcounts = pdf_iedb_tcrs.groupby(["epitope_species", "epitope"]).agg({"tcr_vfamcdr3": "nunique"}).sort_values("tcr_vfamcdr3", ascending=False).reset_index()pdf_iedb_peptide_tcrcounts.columns = ["epitope_species", "epitope", "n_tcrs"]f, ax = plt.subplots()sns.histplot(pdf_iedb_peptide_tcrcounts.n_tcrs)ax.set_yscale("log")ax.set_title("Distribution of TCR counts per IEDB peptide")pdf_iedb_peptide_tcrcounts[:10]
Loading ITables v2.9.1 from the init_notebook_mode cell...
(need help?)
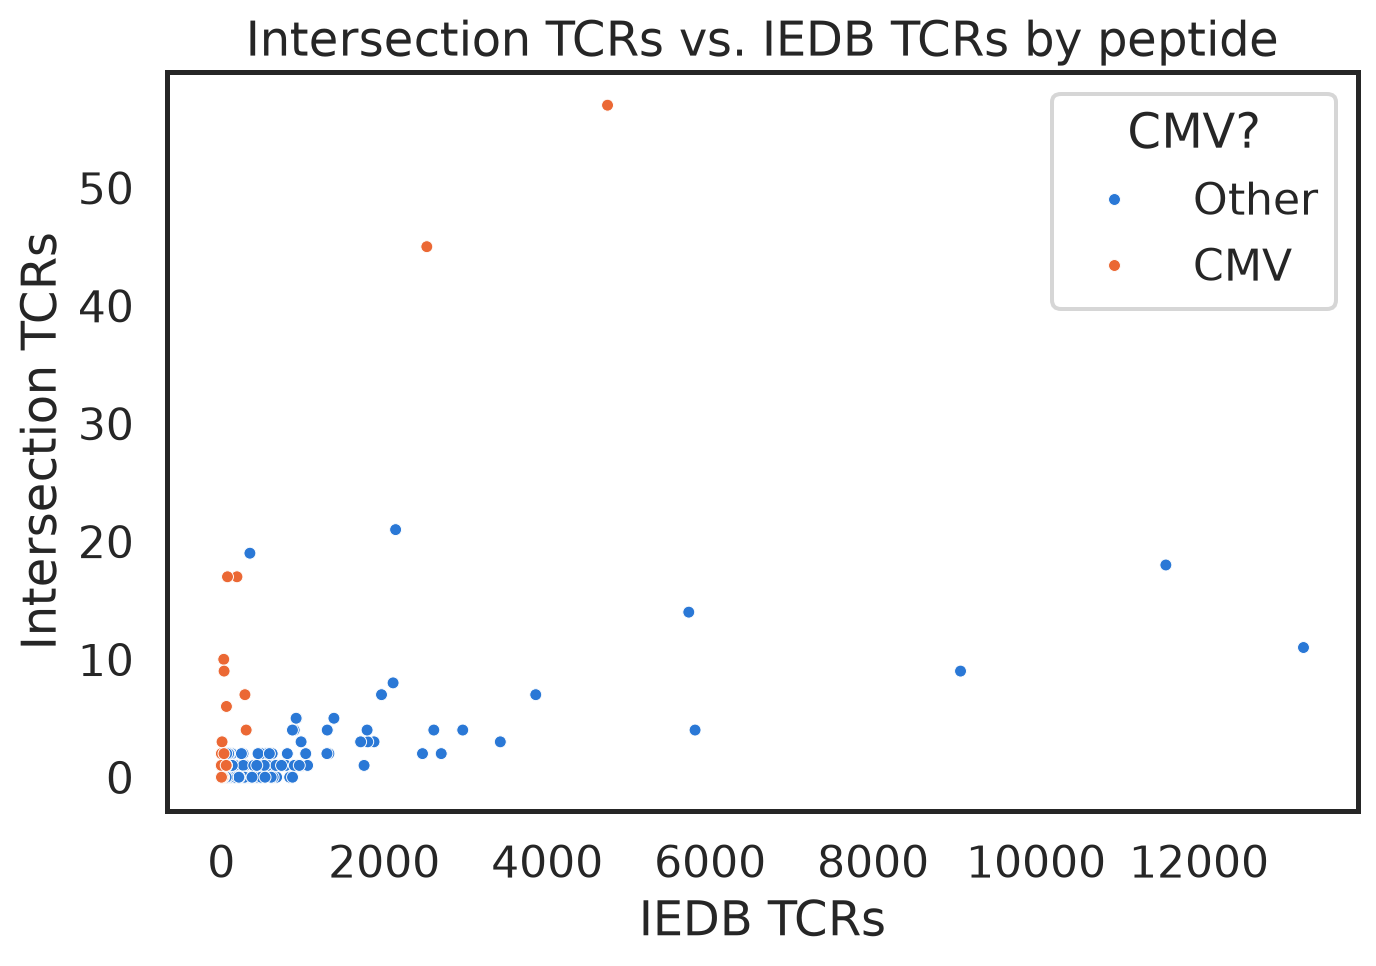
Interesting! We see several CMV peptides with outsized intersection counts, as expected. But there are also two non-CMV peptides that are outliers: LPRRSGAAGA, from Influenza, and YIFFASFYY, from SARS-CoV-1.
I have a hypothesis: there are TCRs that are cross-reactive between one of those two non-CMV peptides and a CMV peptide.
5.1 LPRRSGAAGA
Let’s start with LPRRSGAAGA. How many TCRs in IEDB are associated with that peptide? How many of those are also associated with a CMV peptide? Here’s a breakdown of the IEDB observations of peptides observed binding LPRRSGAAGA (could be multiple per TCR):
Of 2,140 TCRs associated with LPRRSGAAGA (Influenza NP), 2,110 are also associated with TPRVTGGGAM (CMV pp65). That’s statistically impossible by chance. It’s about as strong a signal as we could observe in IEDB for cross-reactivity between those two peptides.
5.2 YIFFASFYY
Let’s take a look at YIFFASFYY, the SARS-CoV-1 peptide.
ORF3a protein [Severe acute respiratory syndrome coronavirus 2]
SARS-CoV2
1
FVCNLLLLFVTVYSHLLLV
ORF3a protein [Severe acute respiratory syndrome coronavirus 2]
SARS-CoV2
1
(4 more rows not shown)
Nope! A couple of the TCRs associated with YIFFASFYY are also associated with CMV peptides, but there’s no smoking gun like with LPRRSGAAGA. My guess is still that the TCRs associated with YIFFASFYY are cross-reactive with some CMV peptide, but one that isn’t captured in IEDB. But there’s no evidence for that, so it’ll remain a guess… for now. I’ll sharpen that guess with some sequence cluster analysis further down in this post.
5.3 Interpreting these results
YIFFASFYY shows how lucky we got with LPRRSGAAGA and TPRVTGGGAM. The TCRs that recognize LPRRSGAAGA and TPRVTGGGAM appear to be cross-reactive and extraordinarily well-documented in IEDB. That suggests to me that both those epitopes are highly immunogenic, which presents a puzzle: why are those TCRs in the CMV ECOcluster? Shouldn’t they cluster less strongly with CMV, if they’re also responding to Influenza?
I think there are two main possibilities: either LPRRSGAAGA isn’t processed and presented, or, probably more likely, CMV simply dominates the clustering because it causes such a drastic T-cell response.
6 Using IEDB to interpret the CMV ECOcluster
So, finally, let’s do the most obvious thing, which is to look at the IEDB peptides associated with CMV ECOcluster TCRs and try to interpret the CMV ECOcluster in terms of those peptides.
First, let’s look at the HLA associations the CMV TCRs in IEDB (all of them, not just the ECOcluster TCRs). Many of them are missing.
Code
pdf_iedb_cmv_tcrs = pdf_iedb_tcrs[pdf_iedb_tcrs.epitope_species =="CMV"].sort_values("hla").drop_duplicates(["tcr_vfamcdr3"])n_with_hla =sum(pdf_iedb_cmv_tcrs.hla.notnull())print(f"{n_with_hla} of {len(pdf_iedb_cmv_tcrs)} CMV ECOcluster TCRs in IEDB have HLA information")pdf_iedb_cmv_tcrs["hla_class_iedb"] = pdf_iedb_cmv_tcrs.hla.apply(lambda x: "unknown"if ((x isNone) or (type(x) ==float) or pd.isna(x)) else"cii"if"D"in x else"ci")pdf_iedb_cmv_tcrs.hla_class_iedb.value_counts().reset_index()
5164 of 8310 CMV ECOcluster TCRs in IEDB have HLA information
Loading ITables v2.9.1 from the init_notebook_mode cell...
(need help?)
So, 110 out of 180 intersection TCRs agree on the HLA allele, 58 are missing an HLA call in IEDB, and of the 13 that disagree 8 at least agree on the HLA class.
Let’s take a look at all these intersection TCRs. How do they break down by HLA class?
pp65,tegument protein pp65 [Human betaherpesvirus 5]
4
1
DNA processivity factor,pp50
3
1
UL123; IE1
3
1
DNA processivity factor
3
0
(9 more rows not shown)
The CMV ECOcluster is very Class II-heavy and CMV IEDB is very Class I-heavy. The intersection is very Class I-heavy. Heavy enough that I don’t think we can say anything about the Class I / Class II breakdown by gene: there are no IEDB genes that are dominated by Class II TCRs that buck the general trend. If we had more data, maybe we could see something more subtle.
6.1 Sequence clustering and epitope propagation
Let’s do some very simplistic sequence clustering to show how we could propagate those TCR annotations from IEDB to other CMV ECOcluster TCRs.
Define TCR sequence neighbors as pairs of TCRs in the same HLA-cocluster with the same V family, with a single amino acid swap. That’s pretty crude, but in this context it should be very safe: if anything, we’ll be missing a lot.
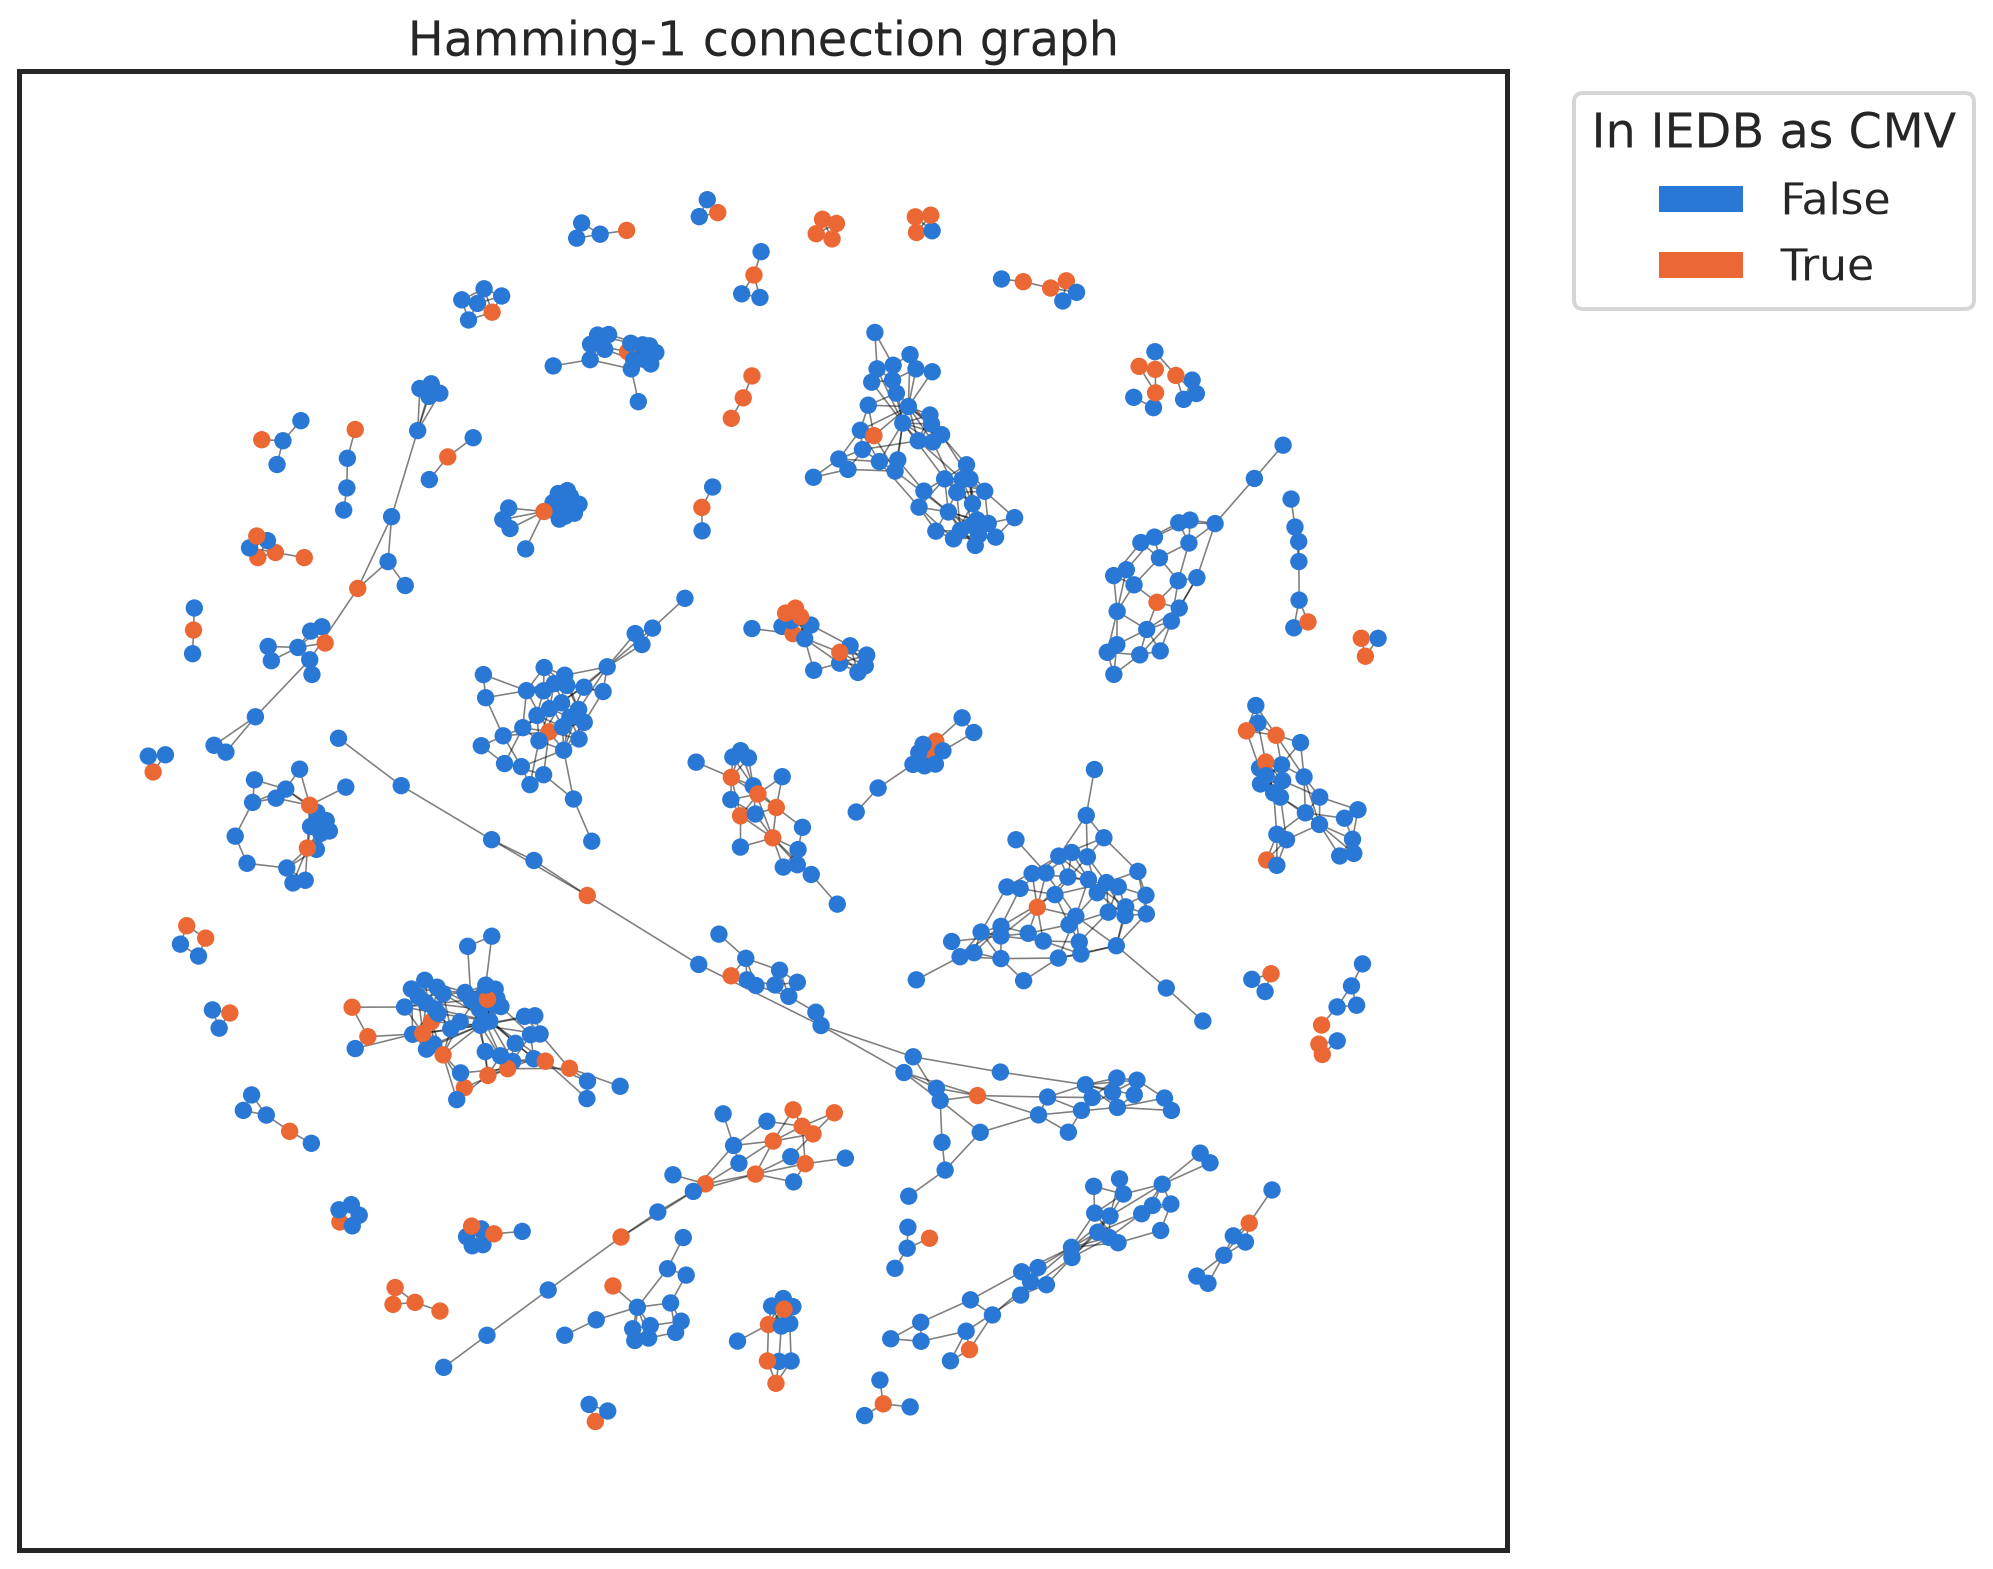
Then, build a graph on those neighbor pairs. Find the connected components with at least 3 TCRs, and see which of those connected components contain at least one TCR that is annotated in IEDB as CMV. Those are candidates for propagating IEDB TCR annotations to the rest of the sequence cluster.
Code
from cmvividly.data.hamming1_pairs import find_hamming1_pairs_same_vjfrom cmvividly.data.hamming1_graph import build_seq_ham1_graph, extract_connected_componentspdf_cmveco_annotiedb = pdf_cmv_ecocluster_2026_formerge_dedup.merge(pdf_iedb_cmv_tcrs, on="tcr_vfamcdr3", how="left")pdf_cmveco_annotiedb["tcr"] = pdf_cmveco_annotiedb["tcr_vfamcdr3"] +"+"+ pdf_cmveco_annotiedb.hla_coclusterpdf_cmveco_hamming1 = find_hamming1_pairs_same_vj(pdf_cmveco_annotiedb)G = build_seq_ham1_graph(pdf_cmveco_annotiedb, seq_column="tcr", same_vj=True)pdf_ccs = extract_connected_components(G, min_seqs=3, seq_column="tcr")tcrs_cmv_iedb =set(pdf_cmveco_annotiedb[pdf_cmveco_annotiedb.epitope_gene.notnull()].tcr)pdf_ccs["is_cmv_iedb"] = pdf_ccs.tcr.isin(tcrs_cmv_iedb)ccs_with_cmv_iedb =set(pdf_ccs[pdf_ccs.is_cmv_iedb].connected_component)tcrs_in_ccs_with_cmv_iedb =set(pdf_ccs[pdf_ccs.connected_component.isin(ccs_with_cmv_iedb)].tcr)from cmvividly.data.hamming1_graph import plot_seq_ham1_graph# restrict G to just the nodes in tcrs_in_ccsG_restricted = G.subgraph(tcrs_in_ccs_with_cmv_iedb)# set an attribute on each node in G_restricted indicating whether it's in tcrs_cmv_iedbfor node in G_restricted.nodes: G_restricted.nodes[node]["CMV IEDB"] = node in tcrs_cmv_iedbprint(f"{len(G_restricted.nodes)} TCRs are in sequence clusters of size 3+ in which at least one member is in IEDB annotated as CMV")plot_seq_ham1_graph(G_restricted, node_color_attribute="CMV IEDB", show_legend=True, legend_title="In IEDB as CMV")
602 TCRs are in sequence clusters of size 3+ in which at least one member is in IEDB annotated as CMV
To have faith in such propagated peptide assignments, we’d want to do something a little more rigorous and cautious. But, ballpark, we can propagate the IEDB CMV annotations from 180 TCRs to a total of 602 TCRs, making the CMV ECOcluster intersection with a given repertoire more interpretable.
6.2 Sequence clusters enriched for non-CMV epitopes
We can also use this sequence clustering approach to find connected components that have a lot of TCRs associated with the same non-CMV epitope. That would suggest cross-reactivity of the TCR cluster. We might expect to see LPRRSGAAGA (Influenza NP) and YIFFASFYY (SARS-CoV-1) show up in this way.
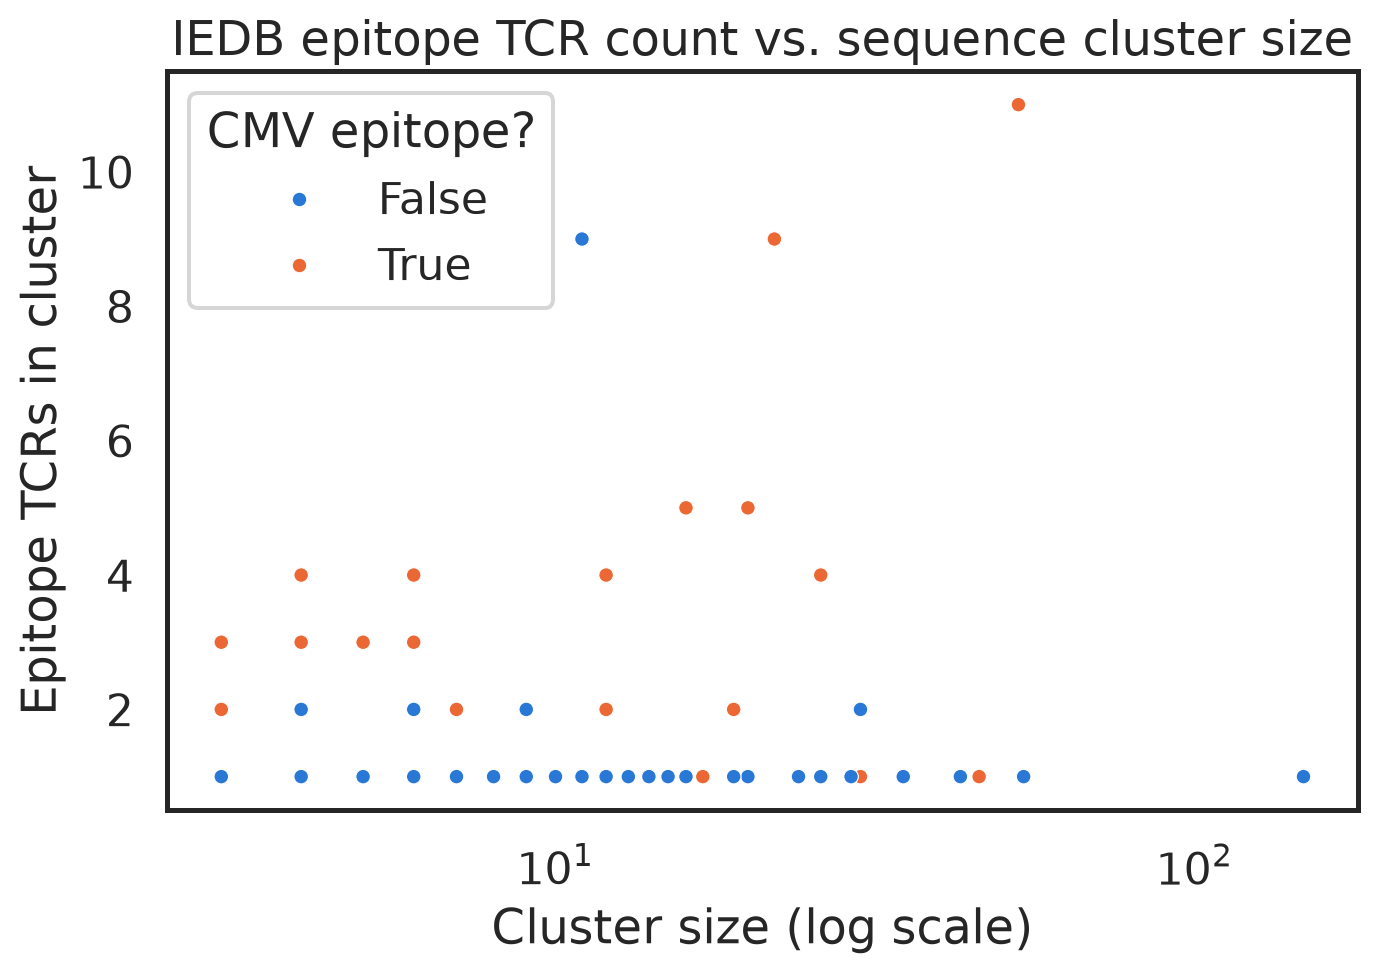
Looks like there’s just one sequence cluster dominated by a non-CMV epitope, and a few more with two TCRs associated with the same non-CMV epitope. Let’s see what the big one is.
Sure enough, it’s the one we noticed earlier, SARS-CoV-1 YIFFASFYY: 9 of 11 TCRs in connected component 2557 are in IEDB associated with that epitope. That’s about as solid evidence as we could want that those TCRs are cross-reactive with that epitope. There are no CMV-associated TCRs in that connected component, so we don’t know what CMV peptide it’s cross-reactive with (which is why we didn’t find it with the earlier approach).
LPRRSGAAGA shows up in a couple clusters, but those TCRs must be less sequence-similar.
6.3 Takeaways from cross-reactivity observations
Experimental evidence of TCR-pMHC binding isn’t enough to pin down a TCR as specific to that epitope. If all you had to go on was IEDB, you’d annotate 9 TCRs in connected component 2557 as SARS-CoV-1. Since they’re in a sequence cluster, you might feel quite certain that you’d annotated them directly. But the CMV ECOcluster tells us that, though those TCRs very likely do bind YIFFASFYY, their occurrence in repertoires is dominated by their binding some CMV peptide.
We found two such examples through two different types of analysis of just the CMV ECOcluster and IEDB. Logically, and also in my experience, that’s just the tip of the iceberg: TCR cross-reactivity is not only theoretically possible, it’s rampant and relevant, because TCRs often respond to multiple peptides that are presented by different prevalent immune exposures.
This means that repertoire TCR annotation via TCR-pMHC binding evidence alone is tenuous. As we observed above, low-pGen TCRs are less likely to be observed binding multiple antigens, so we can have relatively more confidence in annotation of low-pGen TCRs with TCR-pMHC binding evidence.