Predicting CMV status and HLA type

Intersect CMV ECOcluster TCRs with repertoires to predict CMV status and HLA type.
Published

August 10, 2026

1 Takeaways from this post

  • The CMV ECOcluster is a very good predictor of CMV status, even without accounting for donor HLA type
  • But donor HLA type does matter! Asian or Pacific Islander donors have fewer CMV ECOcluster TCRs.
  • Among CMV+ donors, the CMV ECOcluster can be used to predict donor HLA allele status for several alleles with high sensitivity and specificity
    • Those HLA “models” could be used as a seed for stronger, generalized models
Code
# useful imports
import pandas as pd
from matplotlib import pyplot as plt

import itables
import seaborn as sns
from cmvividly.plots.style import set_style
set_style()

import itables
itables.init_notebook_mode()

#stats
from scipy.stats import mannwhitneyu

3 Summarize the intersection per sample

Let’s evaluate three metrics on their ability to separate CMV+ from CMV- donors:

  • match count (n_matches): the number of TCRs in the sample that match the CMV ECOcluster
  • breadth: the fraction of TCRs in the sample that match the CMV ECOcluster
  • depth: the sum of productive frequencies of TCRs in the sample that match the CMV ECOcluster
Code
# count matches per row
import numpy as np
pdf_tcrmatch_rowcounts = pdf_tcr_matches_2026.groupby("sample_name").agg({
    "tcr_repertoire": "count",
    "productive_frequency": "sum"
}).reset_index()
pdf_tcrmatch_rowcounts.columns = ["sample_name", "n_matches", "depth"]
pdf_exactmatch_rowcounts_withmeta = pdf_sample_metadata.merge(pdf_tcrmatch_rowcounts, how="left", on="sample_name").fillna(0)
pdf_exactmatch_rowcounts_withmeta["breadth"] = pdf_exactmatch_rowcounts_withmeta["n_matches"] / pdf_exactmatch_rowcounts_withmeta["productive_rearrangements"]

# add log10-transformed columns for plotting
# add an epsilon to breadth/depth for log10 transformation
EPS = 1e-4
pdf_exactmatch_rowcounts_withmeta["log10_breadth"] = np.log10(pdf_exactmatch_rowcounts_withmeta["breadth"] + EPS)
pdf_exactmatch_rowcounts_withmeta["log10_depth"] = np.log10(pdf_exactmatch_rowcounts_withmeta["depth"] + EPS)
pdf_exactmatch_rowcounts_withmeta
sample_name cmv_status cohort productive_rearrangements sex ethnicity race Tissue Source age hla_class_i n_matches depth breadth log10_breadth log10_depth
P000761.0cohort_159552FemaleUnknown EthnicityUnknown racial groupPBMC,Peripheral blood lymphocytes (PBL),T cells,gDNA48.00264.00.0117520.004433-2.343605-1.926224
Keck0076_MC11.0cohort_2287910MaleNon-Hispanic or LatinoAsian or Pacific IslanderPBMC,Peripheral blood lymphocytes (PBL),T cells,gDNA27.00387.00.0128100.001344-2.840382-1.889078
P004021.0cohort_1471962MaleNon-Hispanic or LatinoCaucasianPBMC,Peripheral blood lymphocytes (PBL),T cells,gDNA42.0HLA-A*03,HLA-A*26,HLA-B*38,HLA-B*44599.00.0033630.001269-2.863543-2.460584
P006550.0cohort_11941420Unknown EthnicityUnknown racial groupPBMC,Peripheral blood lymphocytes (PBL),T cells,gDNA0.0HLA-A*02,HLA-B*40,HLA-B*51131.00.0007450.000675-3.110831-3.073262
Keck0067_MC11.0cohort_2153019MaleNon-Hispanic or LatinoAsian or Pacific IslanderPBMC,Peripheral blood lymphocytes (PBL),T cells,gDNA28.00135.00.0016940.000882-3.007781-2.746235
P001810.0cohort_1233425MaleNon-Hispanic or LatinoCaucasianPBMC,Peripheral blood lymphocytes (PBL),T cells,gDNA37.0HLA-A*01,HLA-A*03,HLA-B*08,HLA-B*49143.00.0007360.000613-3.147144-3.077621
P003340.0cohort_1126607MaleUnknown EthnicityUnknown racial groupPBMC,Peripheral blood lymphocytes (PBL),T cells,gDNA47.0HLA-A*02,HLA-A*03,HLA-B*07,HLA-B*1456.00.0005080.000442-3.265749-3.215779
P000430.0cohort_1181775FemaleUnknown EthnicityUnknown racial groupPBMC,Peripheral blood lymphocytes (PBL),T cells,gDNA0.0HLA-A*24,HLA-A*30,HLA-B*13,HLA-B*5198.00.0005100.000539-3.194412-3.214335
P005800.0cohort_1149611MaleUnknown EthnicityUnknown racial groupPBMC,Peripheral blood lymphocytes (PBL),T cells,gDNA54.0HLA-A*01,HLA-A*03,HLA-B*08,HLA-B*1588.00.0013050.000588-3.162290-2.852307
P006360.0cohort_1202287MaleNon-Hispanic or LatinoCaucasianPBMC,Peripheral blood lymphocytes (PBL),T cells,gDNA42.0HLA-A*11,HLA-A*32,HLA-B*07,HLA-B*15136.00.0008270.000672-3.112207-3.033045
(776 more rows not shown)

3.1 Visualize the intersection by cohort and CMV status

Visualize the difference in this intersection between CMV+ and CMV- donors. Three metrics: * match count (n_matches): the number of TCRs in the sample that match the CMV ECOcluster * breadth: the fraction of TCRs in the sample that match the CMV ECOcluster * depth: the sum of productive frequencies of TCRs in the sample that match the CMV ECOcluster

Code
# boxplot of matches by CMV status
f, (ax1, ax2, ax3) = plt.subplots(1, 3, figsize=(12, 6))

sns.boxplot(data=pdf_exactmatch_rowcounts_withmeta, x="cohort", y="n_matches", hue="cmv_status", ax=ax1)
ax1.set_title("Matched TCRs")
sns.boxplot(data=pdf_exactmatch_rowcounts_withmeta, x="cohort", y="log10_breadth", hue="cmv_status", ax=ax2)
ax2.set_title("Breadth (log10)")
# hide ax2's legend
ax2.get_legend().remove()
sns.boxplot(data=pdf_exactmatch_rowcounts_withmeta, x="cohort", y="log10_depth", hue="cmv_status", ax=ax3)
ax3.set_title("Depth (log10)")
ax3.get_legend().remove()

f.suptitle("ECOcluster matched TCRs / breadth / depth\nby cohort and CMV status")
f.tight_layout()

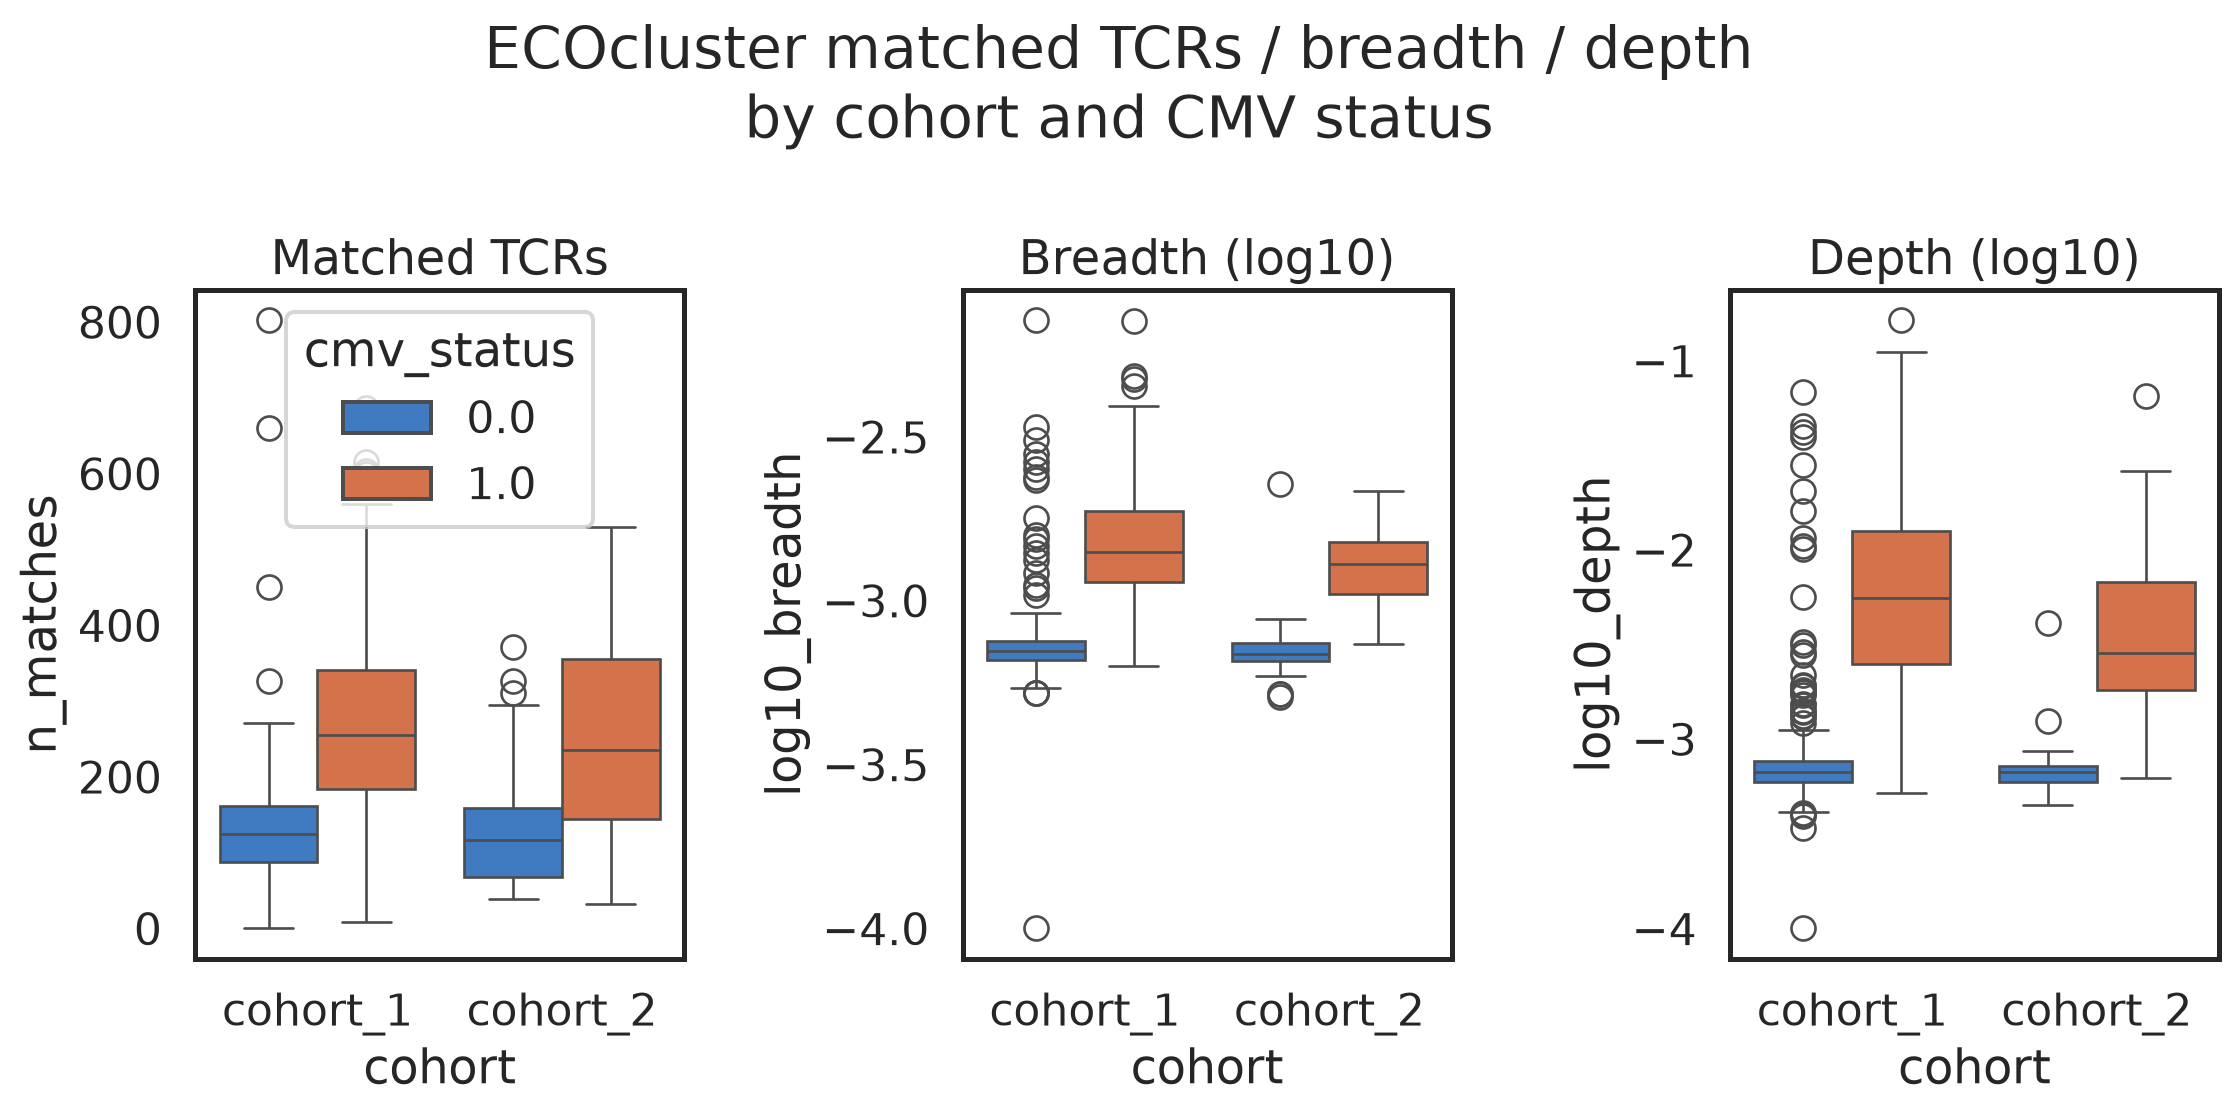
All three metrics show separation, but breadth and depth, which account for sequencing depth, show far better separation than match count.

4 Assess diagnostic performance

Build ROC curves using match count, breadth and depth.

Code
from cmvividly.plots.roc_utils import plot_roc, calc_auroc
f, ax = plt.subplots(figsize=(5, 5))

auroc_matches = calc_auroc(pdf_exactmatch_rowcounts_withmeta, "n_matches", "cmv_status")
auroc_breadth = calc_auroc(pdf_exactmatch_rowcounts_withmeta, "breadth", "cmv_status")
auroc_depth = calc_auroc(pdf_exactmatch_rowcounts_withmeta, "depth", "cmv_status")

plot_roc(pdf_exactmatch_rowcounts_withmeta, "n_matches", label_col="cmv_status", ax=ax, label=f"matches (AUC={auroc_matches:.2f})")
plot_roc(pdf_exactmatch_rowcounts_withmeta, "breadth", label_col="cmv_status", ax=ax, label=f"breadth (AUC={auroc_breadth:.2f})")
plot_roc(pdf_exactmatch_rowcounts_withmeta, "depth", label_col="cmv_status", ax=ax, label=f"depth (AUC={auroc_depth:.2f})")
ax.set_title("ROC curves predicting CMV status\nusing raw match count, breadth and depth")
pass

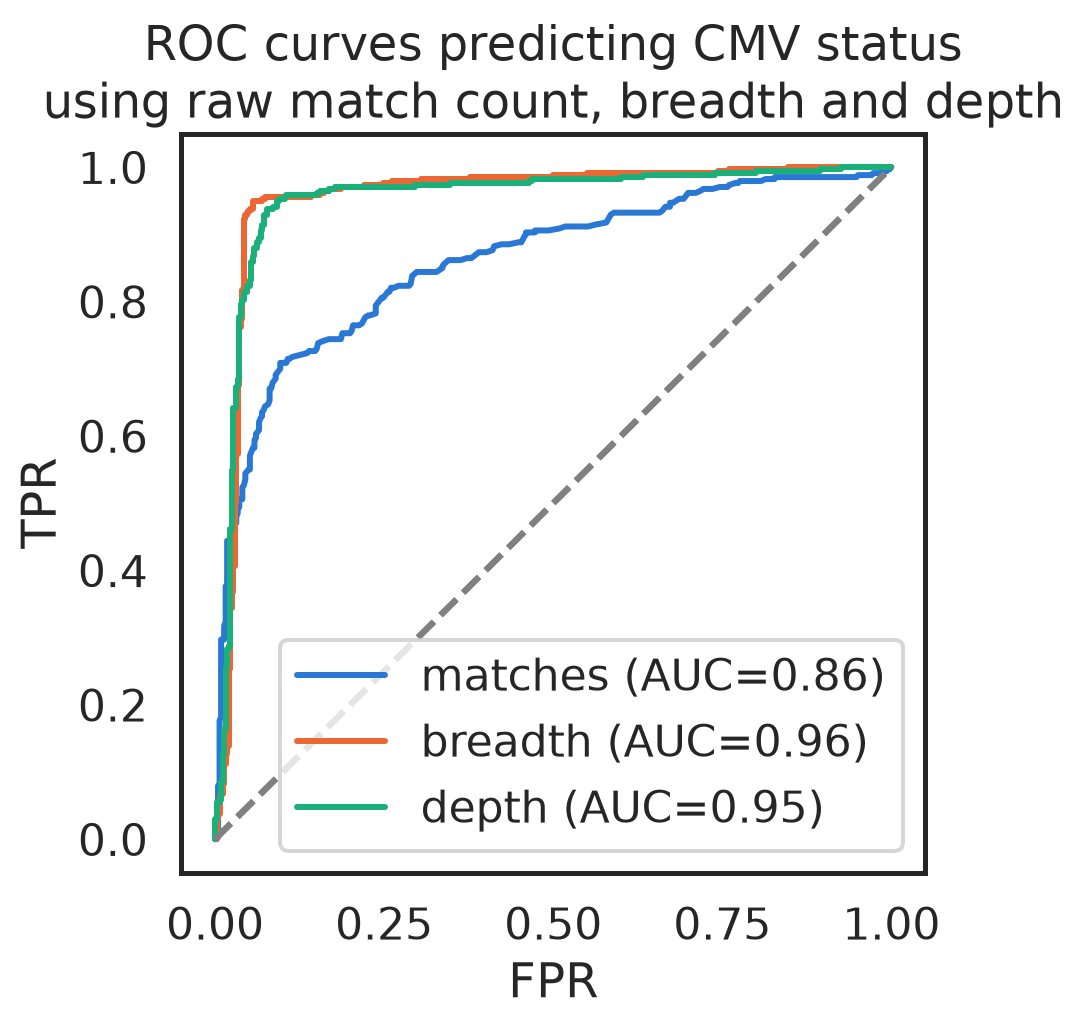
So, after accounting for repertoire depth in one of two ways, the ECOcluster is a very good predictor of CMV status, even though we haven’t accounted for donor HLA type at all.

4.1 Break down performance by race

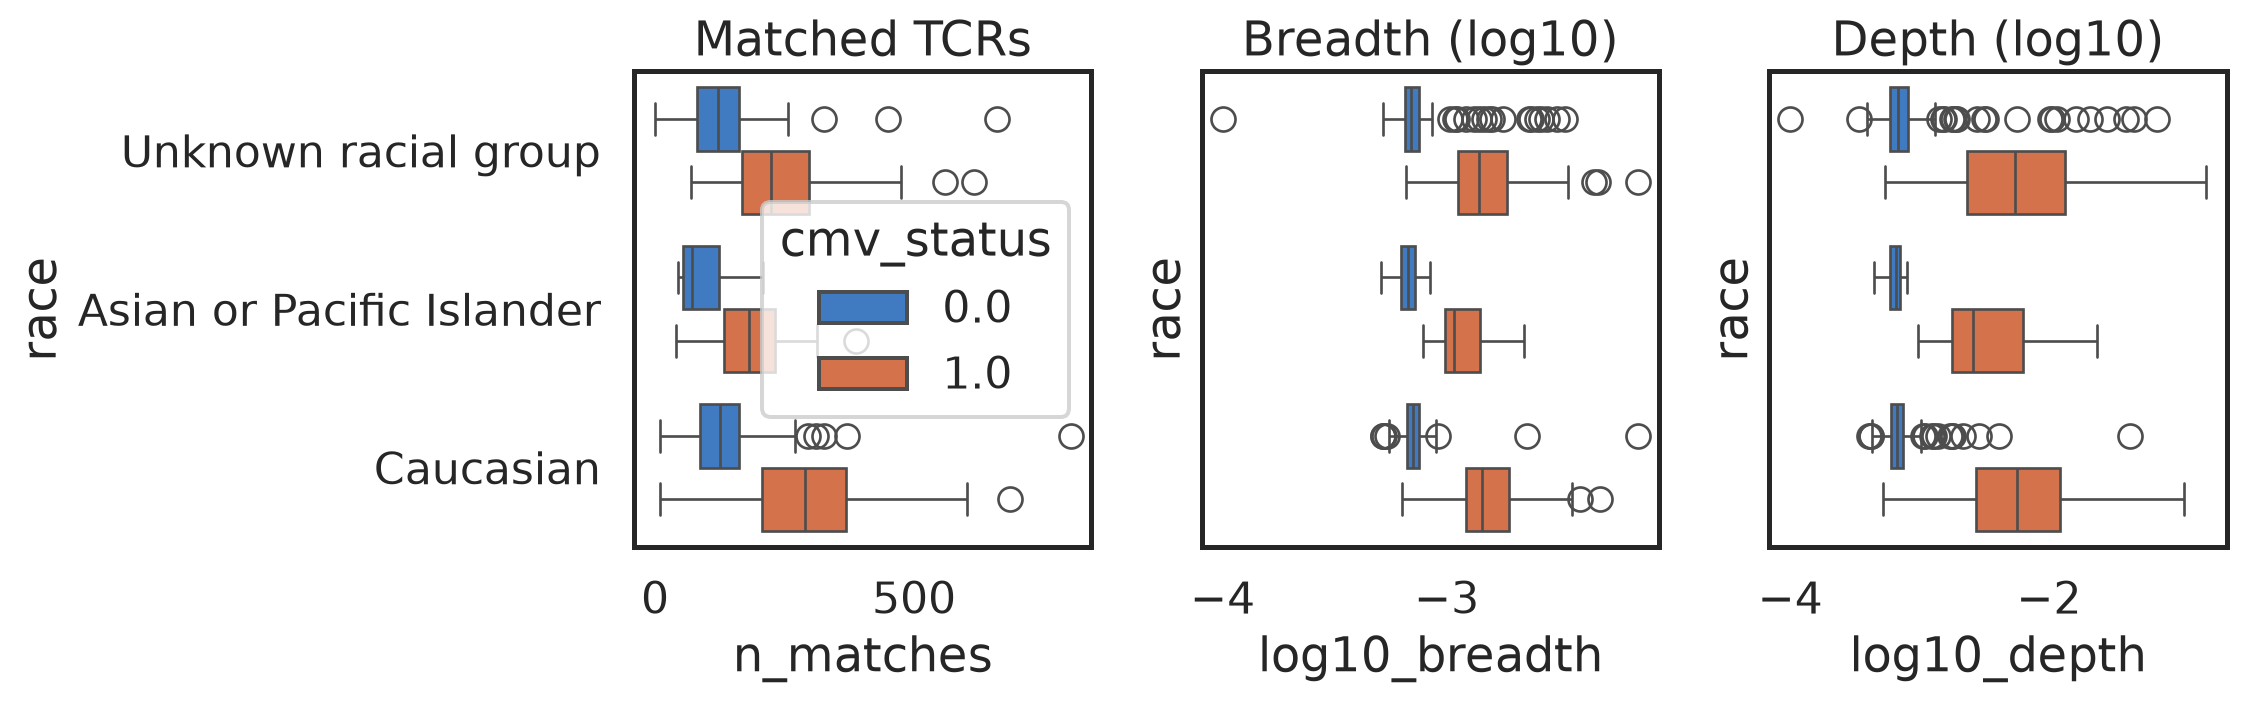
But that doesn’t mean HLA doesn’t matter, even for CMV diagnosis! Race is a loose but useful proxy for HLA type. The CMV ECOcluster was built on repertoires from a wide variety of donors, some explicitly sourced to increase donor diversity. Nevertheless, well over half were Caucasian. Let’s see how these donors break down by the race reported in the metadata:

Code
pdf_exactmatch_rowcounts_withmeta.race.value_counts()
count
race
Caucasian460
Unknown racial group258
Asian or Pacific Islander46
African Race11
Native American or Alaska Native10
01

Those values are straight from the ImmuneAccess file. I’m not sure what race “0” means, so I’ll leave that out. I’ll also leave out the groups with very few donors.

We might expect to see the classifier do better on Caucasians than on other groups, because they share more alleles with the repertoires ECOclusters were built on. Let’s take a look.

Code
pdf_withrace_withenough = pdf_exactmatch_rowcounts_withmeta[
    (pdf_exactmatch_rowcounts_withmeta.race != 0)
    & (~pdf_exactmatch_rowcounts_withmeta.race.isin(["African Race", "Native American or Alaska Native"]))
]
   
f, (ax1, ax2, ax3) = plt.subplots(1, 3, figsize=(12, 4))

sns.boxplot(y="race", x="n_matches", hue="cmv_status", data=pdf_withrace_withenough, ax=ax1)
ax1.set_title("Matched TCRs")
sns.boxplot(y="race", x="log10_breadth", hue="cmv_status", data=pdf_withrace_withenough, ax=ax2)
ax2.set_yticks([])
ax2.set_title("Breadth (log10)")
ax2.get_legend().remove()
sns.boxplot(y="race", x="log10_depth", hue="cmv_status", data=pdf_withrace_withenough, ax=ax3)
ax3.set_yticks([])
ax3.set_title("Depth (log10)")
ax3.get_legend().remove()

f.tight_layout()

Visually, it looks like, among CMV+ donors, breadth, depth and # matches are all lower in the Asian or Pacific Islander group than in the other groups. Let’s test for significance with a two-sided Mann-Whitney U test.

Code
pdf_api = pdf_withrace_withenough[pdf_withrace_withenough.race == "Asian or Pacific Islander"]
pdf_notapi = pdf_withrace_withenough[pdf_withrace_withenough.race != "Asian or Pacific Islander"]
pdf_api_cmvpos = pdf_api[pdf_api.cmv_status == 1]
pdf_notapi_cmvpos = pdf_notapi[pdf_notapi.cmv_status == 1]

mwu_p_matches = mannwhitneyu(pdf_api_cmvpos.n_matches, pdf_notapi_cmvpos.n_matches).pvalue
mwu_p_breadth = mannwhitneyu(pdf_api_cmvpos.breadth, pdf_notapi_cmvpos.breadth).pvalue
mwu_p_depth = mannwhitneyu(pdf_api_cmvpos.depth, pdf_notapi_cmvpos.depth).pvalue

print(f"Two-sided MWU p-values:")
print(f"# matches: {mwu_p_matches:.1e}")
print(f"breadth: {mwu_p_breadth:.1e}")
print(f"depth: {mwu_p_depth:.1e}")
Two-sided MWU p-values:
# matches: 6.2e-05
breadth: 1.7e-04
depth: 4.9e-03

Yes, these differences are highly significant, particularly for match count and breadth. In the preprint, we took great pains to account for those differences, using inferred HLA types on all the donors and comparing breadths against reference distributions for donors with the associated allele.

Let’s take a look at ROC curves within each group:

Code
f, ax = plt.subplots(figsize=(5, 5))
for race in sorted(pdf_withrace_withenough.race.unique().tolist()):
    pdf_race = pdf_withrace_withenough[pdf_withrace_withenough.race == race]
    auroc_matches = calc_auroc(pdf_race, "breadth", "cmv_status")
    plot_roc(pdf_race, "breadth", label_col="cmv_status", label=f"{race} (AUC={auroc_matches:.2f})", ax=ax)
ax.legend(bbox_to_anchor=(0.2, 0.5), loc='upper left')
ax.set_title("ROC curves predicting CMV status\nusing breadth, by race")

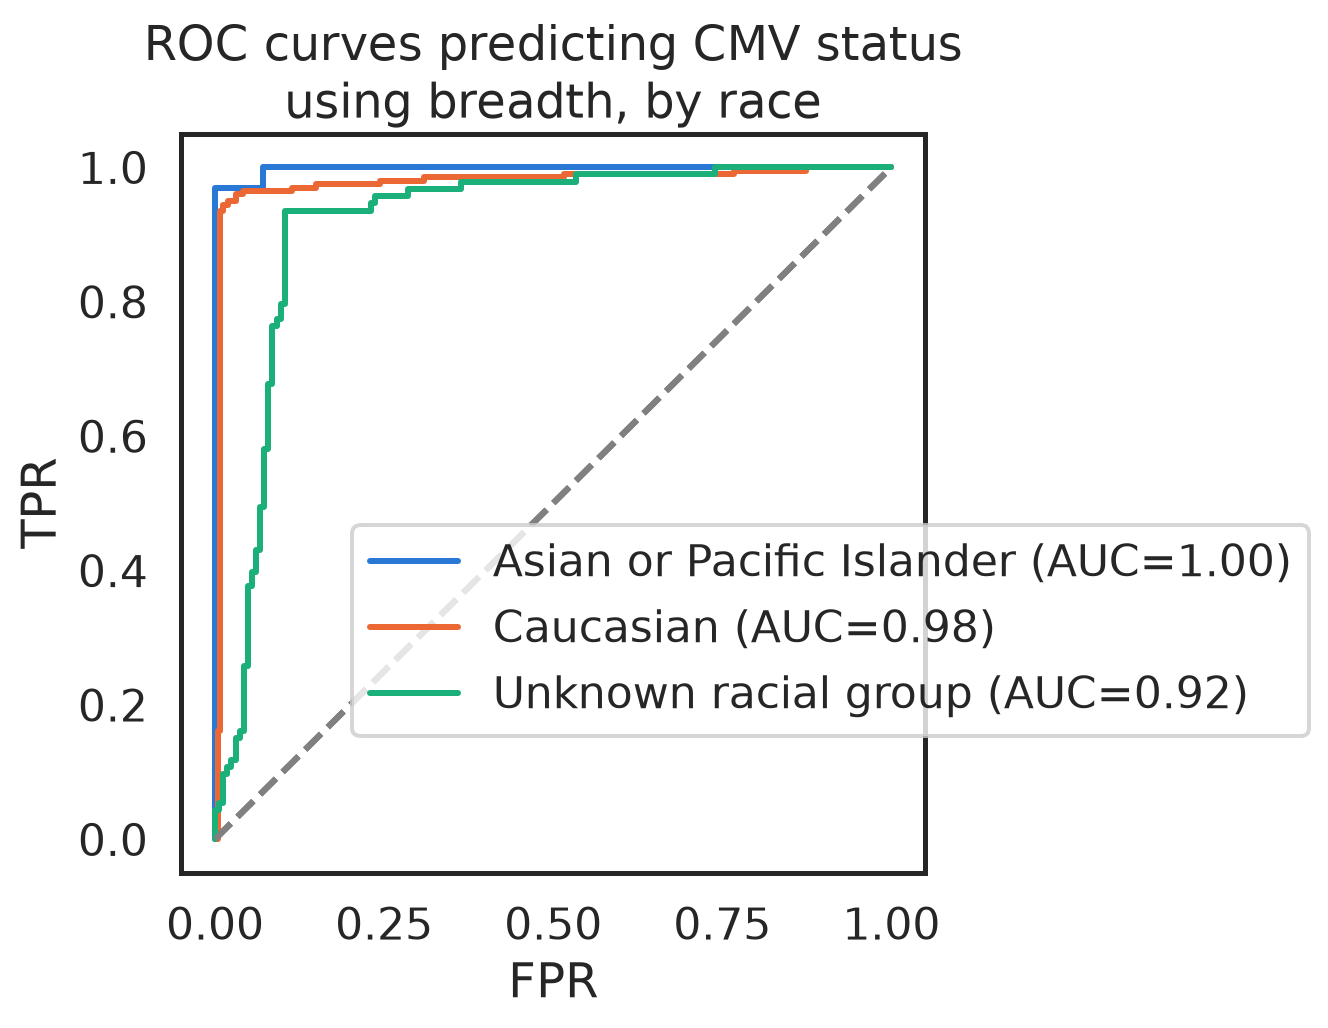
We do markedly worse for the Unknown racial group due to a number of CMV- donors with very high breadth. There are a lot of people in that group, so the difference isn’t likely due to chance. More likely, those donors have HLA alleles whose CMV-COclusters aren’t as well differentiated w.r.t. CMV status and lack other alleles that are better differentiated.

Also, from the boxplots and MWU tests above, we also know that, if we throw all those donors together, API CMV+ donors will be less well-separated from CMV- donors of other races.

5 Infer donor CMV+ donor HLA type from the TCR repertoire

Can we get something useful out of the HLA-bound nature of the CMV TCRs? Can we use it to infer the status of CMV+ donors with respect to the HLA alleles present in the CMV ECOcluster?

If we consider two CMV+ donors, one with HLA allele A*02:01 and one without, only the first donor should have A*02:01-associated TCRs responding to CMV. Since the CMV ECOcluster records the HLA allele associated with each TCR, we can use the A*02:01-associated CMV ECOcluster TCRs in a CMV+ donor’s repertoire to predict whether that donor has A*02:01.

Limitations:

  • All we’ve got is Class I HLA type, for a subset of donors, so we’re entirely blind to Class II
    • (I think the full HLA types for these donors might be floating around somewhere? If you know how to get them, let me know and I’ll redo all this!)
  • The HLA metadata has values like HLA-A*01, while the HLA-COclusters in the CMV ECOcluster are associated with alleles like A*01:01. My workaround here will be to add :01 to the end of the HLA metadata values and see if any HLA-COclusters match. That’s a bit of a hack, and I might be missing some modelable alleles this way, but it demonstrates the idea.
Code
pdf_sample_metadata_withhla = pdf_sample_metadata[pdf_sample_metadata.hla_class_i.notnull()]
pdf_sample_metadata_withhla_cmvpos = pdf_sample_metadata_withhla[pdf_sample_metadata_withhla.cmv_status == 1]
print(f"Number of CMV+ donors with HLA Class I data: {len(pdf_sample_metadata_withhla_cmvpos)}")

all_alleles = set()
for hla_str in pdf_sample_metadata_withhla_cmvpos.hla_class_i:
    alleles = hla_str.split(",")
    all_alleles.update([x for x in alleles if x != "HLA MHC Class I"])  # there's some malformed metadata in there.
print(f"HLA Class I alleles present among CMV+ donors: {len(all_alleles)}")

alleles = sorted(all_alleles)
pos_counts = []
neg_counts = []
for allele in sorted(all_alleles):
    pdf_sample_metadata_withhla[allele] = pdf_sample_metadata_withhla.hla_class_i.apply(lambda x: 1 if allele in str(x).split(",") else 0)
    pos_counts.append(pdf_sample_metadata_withhla[(pdf_sample_metadata_withhla[allele] == 1) & (pdf_sample_metadata_withhla.cmv_status == 1)].shape[0])
    neg_counts.append(pdf_sample_metadata_withhla[(pdf_sample_metadata_withhla[allele] == 1) & (pdf_sample_metadata_withhla.cmv_status == 0)].shape[0])

pdf_pos_neg_counts = pd.DataFrame({
    "allele": sorted(all_alleles),
    "pos_count": pos_counts,
    "neg_count": neg_counts
})

f, ax = plt.subplots()    
sns.histplot(data=pdf_pos_neg_counts, x="pos_count", ax=ax, bins=20)
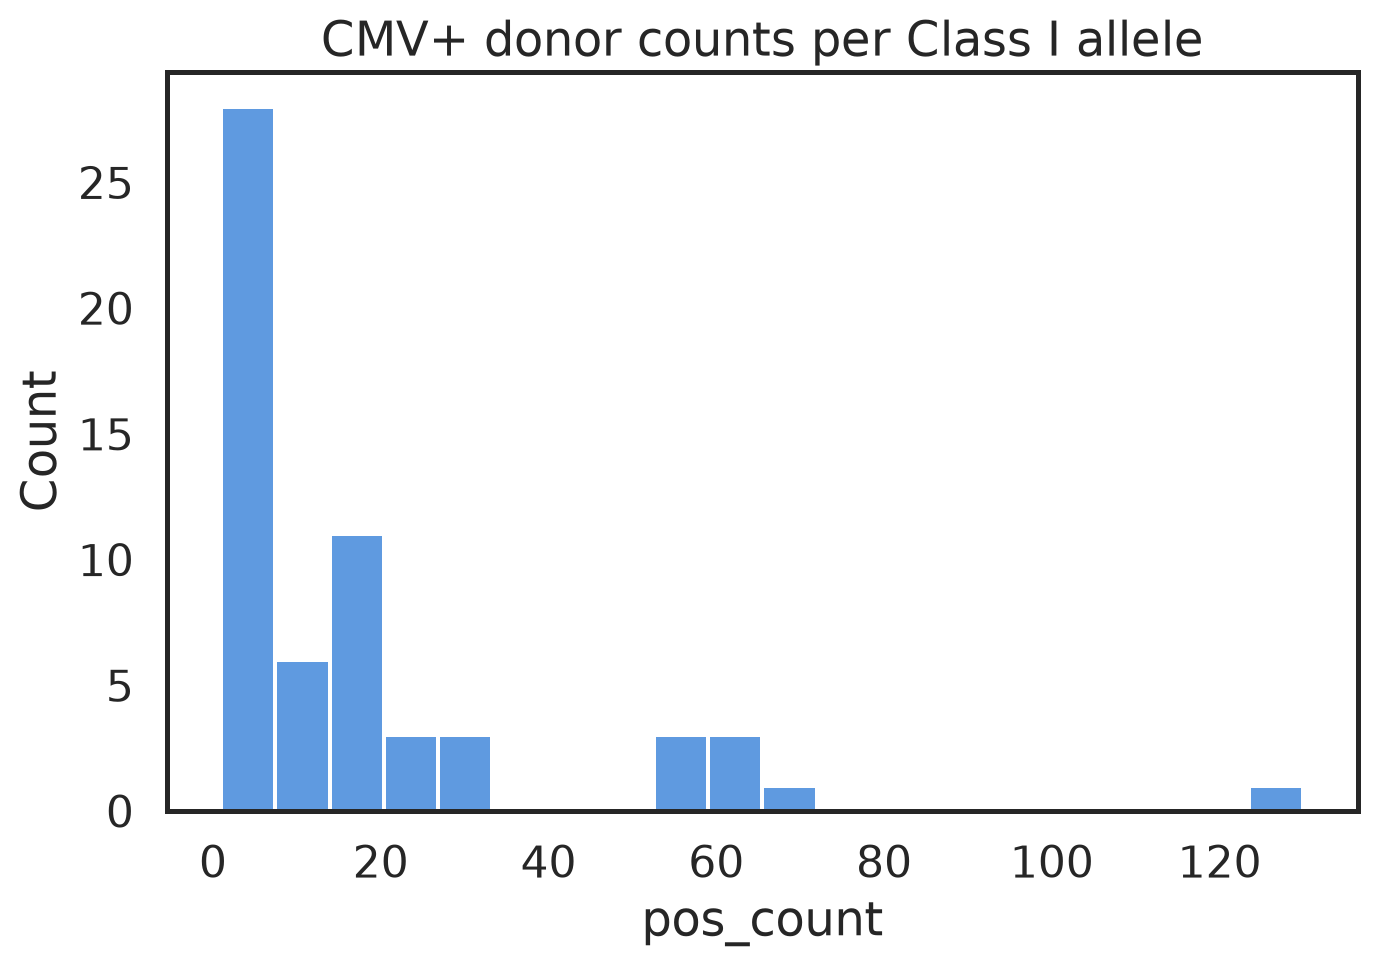
ax.set_title("CMV+ donor counts per Class I allele")
pass
Number of CMV+ donors with HLA Class I data: 274
HLA Class I alleles present among CMV+ donors: 59

A lot of those alleles have very few allele+ donors among the CMV+ donors. Luckily, we don’t really need to train a model! We just need enough donors to assess breadth as a predictor of allele status.

Let’s require at least 10 CMV+ donors with that allele to assess breadth as a predictor of allele status.

Code
alleles_enough_cmvpos = pdf_pos_neg_counts[pdf_pos_neg_counts.pos_count >= 10].allele.tolist()
print(f"Class I alleles with at least 10 CMV+ donors: {len(alleles_enough_cmvpos)}")
# eliminate alleles with no associated HLA-COcluster
alleles_enough_cmvpos_with_hlacocluster = [
    allele for allele in alleles_enough_cmvpos if allele[len("HLA-"):] + ":01" in pdf_tcr_matches_2026.hla.unique().tolist()
]
print(f"...and an associated HLA-COcluster: {len(alleles_enough_cmvpos_with_hlacocluster)}")
Class I alleles with at least 10 CMV+ donors: 28
...and an associated HLA-COcluster: 12

So, there are 12 or so alleles we can reasonably evaluate.

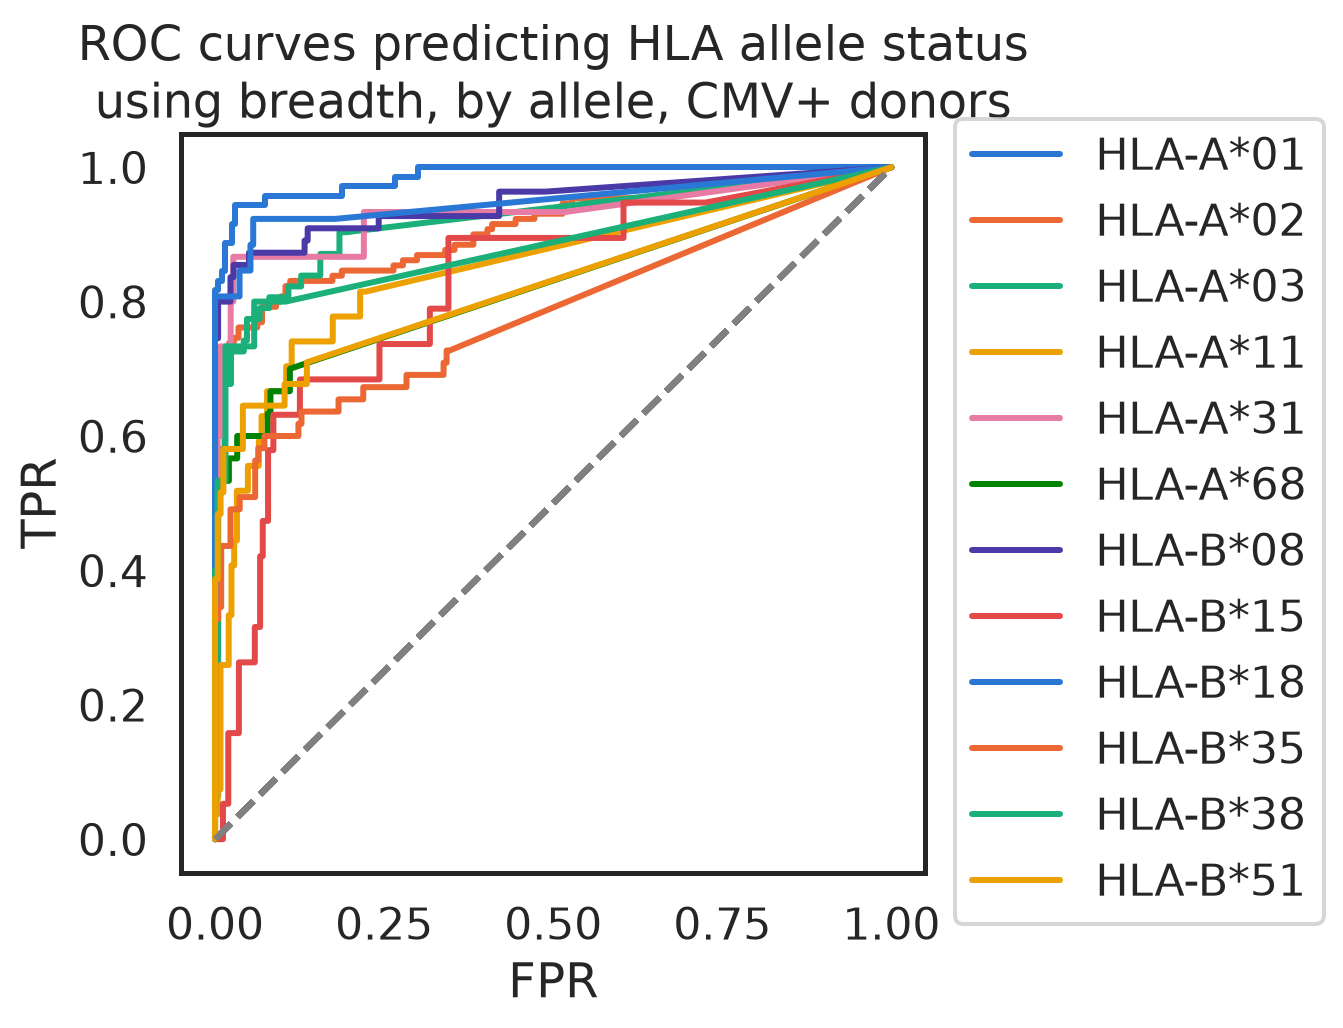
Let’s evaluate breadth on the associated HLA-COcluster as a predictor for having each allele.

Code
from cmvividly.plots.roc_utils import calc_roc_summary

pdf_tcr_matches_2026["hla_for_join"] = pdf_tcr_matches_2026.hla.apply(
    lambda x: x.split("*")[0])
# Join the HLA metadata with the breadth metric and assess breath as a predictor
pdf_sample_metadata_withhla_cmvpos = pdf_sample_metadata_withhla[pdf_sample_metadata_withhla.cmv_status == 1]


def calc_rocs_all_models(pdf_metadata, title_suffix):
    rows = []
    f, ax = plt.subplots()
    
    for allele in alleles_enough_cmvpos_with_hlacocluster:    
        allele_for_join = allele[len("HLA-"):] + ":01"
        pdf_matches_this_allele = pdf_tcr_matches_2026[pdf_tcr_matches_2026.hla == allele_for_join]
        pdf_rowcounts_this_allele = pdf_matches_this_allele.groupby("sample_name").agg({
            "tcr_repertoire": "count",
            "productive_frequency": "sum"
        }).reset_index()
        pdf_rowcounts_this_allele_withmeta = pdf_metadata.merge(
            pdf_rowcounts_this_allele, how="left", on="sample_name").fillna(0)
        pdf_rowcounts_this_allele_withmeta["breadth"] = pdf_rowcounts_this_allele_withmeta["tcr_repertoire"] / pdf_rowcounts_this_allele_withmeta["productive_rearrangements"]
        pdf_rowcounts_this_allele_withmeta["depth"] = pdf_rowcounts_this_allele_withmeta["productive_frequency"]
        auroc_breadth = calc_auroc(pdf_rowcounts_this_allele_withmeta, "breadth", label_col=allele)
        sens_98_spec_breadth = calc_roc_summary(pdf_rowcounts_this_allele_withmeta, "breadth", label_col=allele,
                                                specificities=[0.98])["senses_at_specs"][0]
        auroc_depth = calc_auroc(pdf_rowcounts_this_allele_withmeta, "depth", label_col=allele)
        rows.append({
            "allele": allele,
            "n_cmvpos": sum(pdf_rowcounts_this_allele_withmeta[allele] == 1),
            "auroc_breadth": auroc_breadth,
            "auroc_depth": auroc_depth,
            "sens_98_spec_breadth": sens_98_spec_breadth
        })
        plot_roc(pdf_rowcounts_this_allele_withmeta, 
                 "breadth", label_col=allele, ax=ax, label=allele)
    ax.set_title(f"ROC curves predicting HLA allele status\nusing breadth, by allele, {title_suffix}")
    ax.legend(bbox_to_anchor=(1.01, 1.05), loc='upper left')
    f.set_size_inches(5,5)
    
    pdf_allele_aurocs = pd.DataFrame(rows).sort_values("auroc_breadth", ascending=False)
    return pdf_allele_aurocs

pdf_allele_aurocs_cmvpos = calc_rocs_all_models(pdf_sample_metadata_withhla_cmvpos, "CMV+ donors")

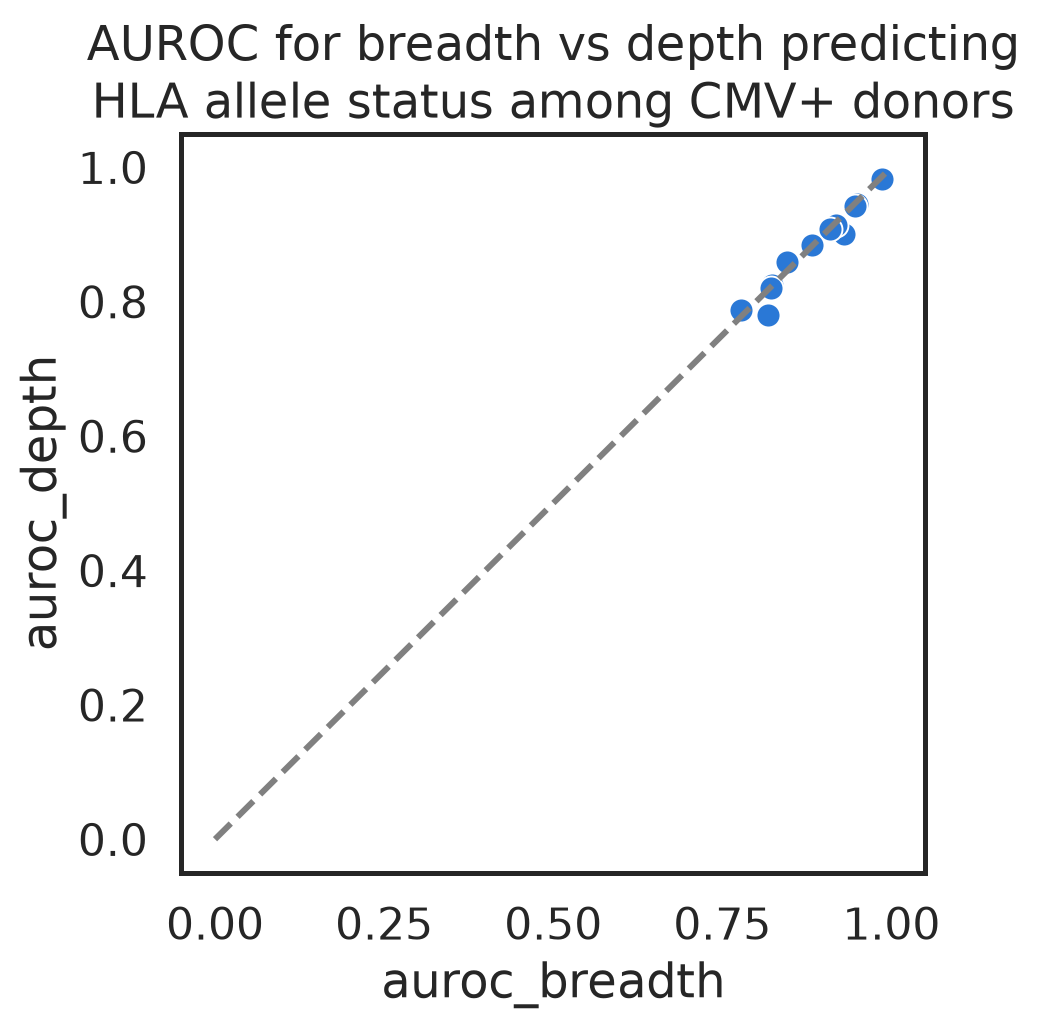
Let’s take a look at the AUROCs and sensitivities at 98% specificity for those models.

Code
f, ax = plt.subplots()
sns.scatterplot(data=pdf_allele_aurocs_cmvpos, y="auroc_depth", x="auroc_breadth")
ax.set_title("AUROC for breadth vs depth predicting\nHLA allele status among CMV+ donors")
sns.lineplot(x=[0, 1], y=[0, 1], color="gray", linestyle="--", ax=ax)
f.set_size_inches(5, 5)
pdf_allele_aurocs_cmvpos
allele n_cmvpos auroc_breadth auroc_depth sens_98_spec_breadth
0HLA-A*01710.9859850.9830710.887324
8HLA-B*18260.9491320.9447890.807692
6HLA-B*08550.9458700.9427150.800000
4HLA-A*31150.9301160.9007720.733333
2HLA-A*03620.9179850.9134210.677419
1HLA-A*021300.9093480.9082800.707692
10HLA-B*38150.8821110.8836550.733333
3HLA-A*11270.8463040.8590490.259259
11HLA-B*51310.8233110.8239750.580645
5HLA-A*68300.8221990.8202870.533333
(2 more rows not shown)

AUROCs based on breadth and on depth are strikingly similar, with a slight advantage to breadth-based models.

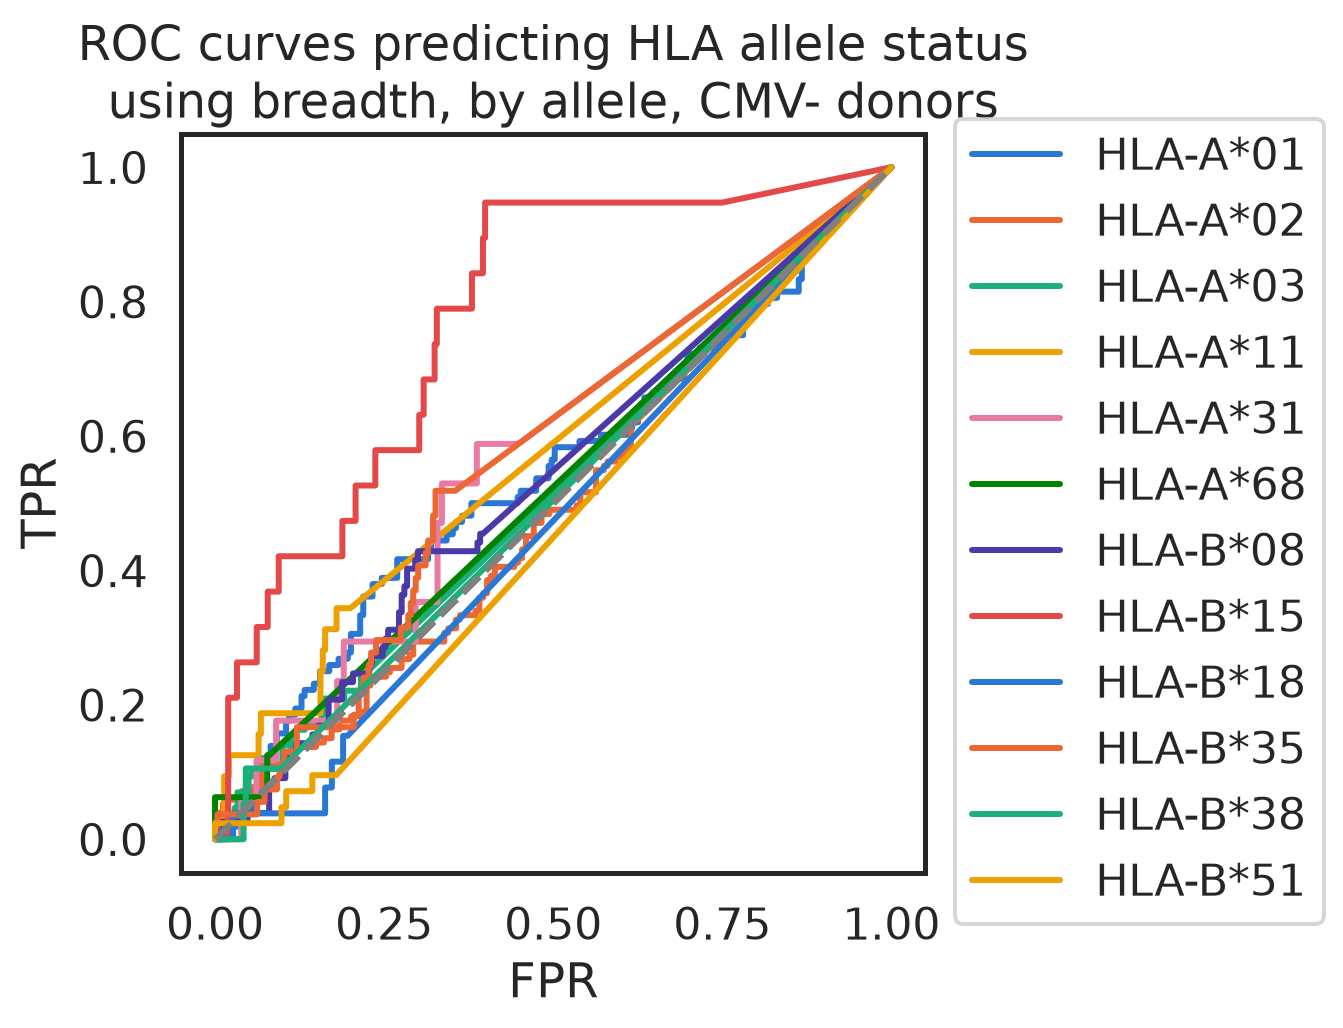
Just to be sure, let’s take a look at those same “models” in CMV- donors. There should be no signal, because those donors shouldn’t have CMV-responding TCRs.

Code
pdf_sample_metadata_withhla_cmvneg = pdf_sample_metadata_withhla[pdf_sample_metadata_withhla.cmv_status == 0]

pdf_allele_aurocs_cmvneg = calc_rocs_all_models(pdf_sample_metadata_withhla_cmvneg, "CMV- donors")

Huh! Most of the alleles are total garbage, as expected. But there’s some signal in A*01. There’s only one A*01:01 HLA-COcluster in the CMV ECOcluster, but perhaps it’s not totally “pure”… maybe it’s dominated by CMV-specific TCRs, but some TCRs also respond to other exposures.

6 Applications of HLA allele models usable on CMV+ donors

So, all but one of those “models” (HLA-B*35) has notable sensitivity at essentially perfect specificity, and they all have AUROC > 0.77. The best 6 models have >70% sensitivity at 98% specificity.

Quite likely, a number of the other alleles represented in the CMV ECOcluster have similar performance, but we don’t have enough CMV+ donors with those alleles in this dataset to assess performance. And of course we haven’t even been able to look at Class II alleles, since we didn’t have any data there.

I think the best HLA allele models, combined with the CMV ECOcluster’s ability to predict CMV status and enough public repertoires, could allow us to “pseudolabel” inferred CMV+ donors with status on those HLAs, learn signal from exposures other than CMV, and build HLA allele models that could be used on both CMV+ and CMV- donors.